Table of content

SMARTe GTM Intelligence
Start Smarter Prospecting Today
Customer churn quietly slows growth before most teams notice it.
When customers leave, revenue drops. Acquisition costs rise. Sales and marketing teams are forced to replace lost accounts instead of growing existing ones. Over time, this cycle makes growth expensive and unpredictable.
Understanding customer churn is the first step to breaking that pattern. When you know what churn is, how it is measured, and why it happens, you can fix retention gaps early. You can protect recurring revenue. You can build growth that compounds instead of resetting every quarter.
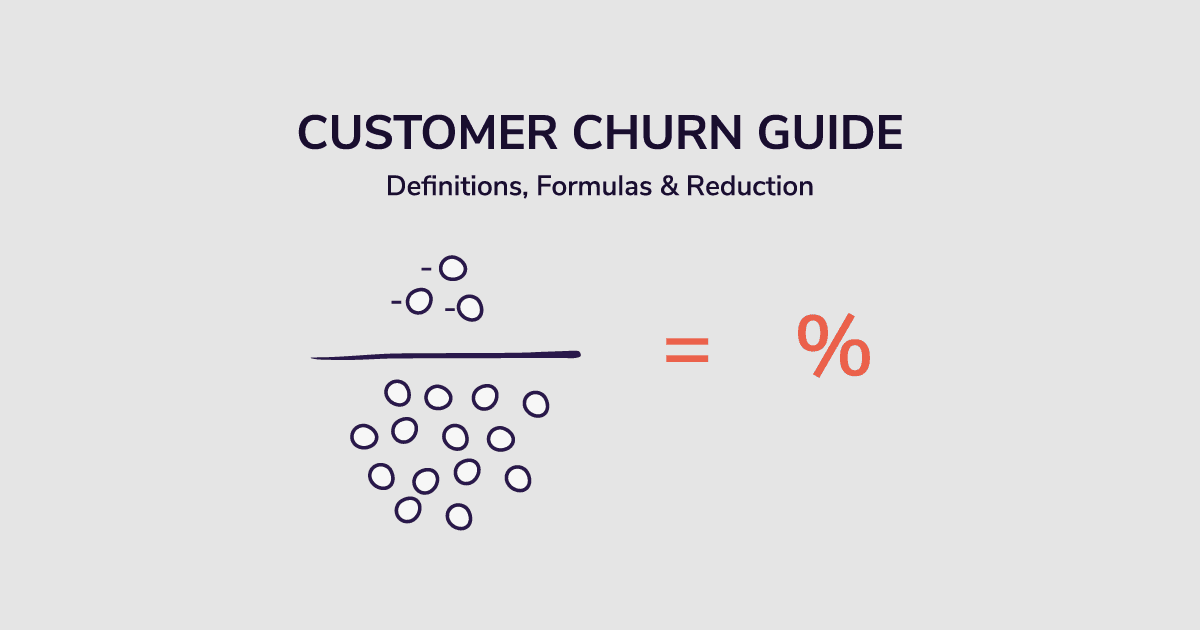
What Is Customer Churn?
Customer churn is the rate at which customers stop doing business with a company. This can happen when customers cancel subscriptions, do not renew contracts, reduce usage, or switch to a competitor. Churn is usually measured as a percentage of customers lost during a specific period.
Customer churn is also called customer attrition. It shows how quickly repeat business is declining. A high churn rate often signals poor customer experience or weak product fit. A low churn rate suggests customers see ongoing value and choose to stay.
Churn is different from one time purchases. It focuses only on customers who were expected to return. This makes churn a critical metric for subscription based, SaaS, and B2B businesses that depend on recurring revenue.
Tracking customer churn helps teams spot retention issues early, improve customer experience, and support long term business growth.
Why Is Reducing Customer Churn Critical for Business Growth?
Reducing customer churn is critical for business growth because churn quietly limits revenue, slows scale, and increases go to market costs. In B2B sales and marketing, growth is not just about adding new logos. It is about keeping customers long enough to recover acquisition costs and expand account value.
When churn is high, teams spend most of their time replacing lost customers instead of growing revenue. This creates short term wins but weak long term results.
1. Customer Retention Has a Direct Impact on Profitability
Customer churn directly affects recurring revenue and lifetime value. Even a small improvement in retention makes a measurable difference. A 5 percent increase in customer retention can increase profits by 25 percent to 95 percent because existing customers are cheaper to serve and more likely to expand.
In most B2B companies, existing customers generate more than 65 percent of total revenue. They renew contracts, upgrade plans, and adopt new features over time. In contrast, acquiring new customers can cost 5 to 25 times more than retaining current ones due to sales cycles, paid acquisition, and onboarding costs.
Lower churn allows revenue to compound instead of resetting each quarter.
SMARTe GTM Intelligence
Start Smarter Prospecting Today
2. Financial Stability Depends on Low Churn
Customer churn creates immediate revenue loss, but the bigger issue is future revenue that never materializes. When a customer leaves, the business loses not just the current contract but the full lifetime value tied to that account.
High churn forces sales and marketing teams into constant replacement mode. Budget shifts away from product innovation and demand generation toward filling revenue gaps. This slows growth and weakens margins.
Churn also makes forecasting difficult. Predictable revenue becomes unreliable, which affects hiring plans, GTM investments, and expansion strategy. In severe cases, churn leads to negative unit economics where customer acquisition costs are higher than the revenue each customer generates.
3. Lower Churn Drives Faster and More Efficient Growth
Reducing customer churn unlocks scalable growth. A stable customer base creates space for upsells, cross sells, renewals, and expansion revenue. These revenue motions are faster, cheaper, and more predictable than new customer acquisition.
Retention also improves sales efficiency. Account managers can focus on expansion instead of damage control. Marketing teams can invest in lifecycle marketing and customer advocacy rather than constant top of funnel replacement.
Satisfied customers also drive referrals, reviews, and word of mouth growth, which lowers acquisition costs and improves lead quality.
4. Predictable Revenue Supports GTM Scale
Low churn creates predictable recurring revenue, which is essential for scaling go to market operations. When revenue is stable, leadership can confidently invest in sales headcount, marketing channels, and product development.
Investors and stakeholders also look closely at churn as a signal of product market fit. Businesses with strong retention are seen as lower risk and more scalable because growth is not dependent on aggressive acquisition spending.
Reducing churn removes the hidden growth tax that comes from constantly replacing lost customers.
5. Retention Builds Competitive Advantage and Valuation
Customer retention strengthens competitive positioning. Customers who stay longer are less likely to switch to competitors, even when pricing or features are similar. Retention reflects trust, value delivery, and switching costs that protect market share.
From a valuation standpoint, low churn increases customer lifetime value, improves margins, and supports higher revenue multiples. Investors favor businesses with durable growth and predictable revenue streams, both of which depend on strong retention.
Note: In B2B sales and marketing, growth does not come from acquisition alone. It comes from keeping customers long enough to expand value and build momentum.
Reducing customer churn protects recurring revenue, improves financial stability, accelerates growth, and strengthens go to market execution. When churn is controlled, growth compounds. When it is ignored, growth stalls.
How to Calculate Customer Churn Rate (Formula & Examples)
Calculating churn rate is the first step toward improving customer retention and customer experience. Churn shows how many customers or how much revenue you lose over a specific period. Depending on your business model, growth stage, and revenue structure, different churn formulas give different insights.
Below are four of the most commonly used churn rate formulas, explained with clear examples.
1. Customer Churn Rate
Customer churn rate measures the percentage of customers who stop doing business with you during a given period. It is one of the most widely used customer experience and retention KPIs.
This formula works for any time frame, including monthly, quarterly, or yearly churn.
Customer Churn Rate Formula
(Customers Lost During Period ÷ Customers at Start of Period) × 100
Example
You start January with 100 customers.
By the end of the month, you have 90 customers.
Customers lost = 10
Customer churn rate = (10 ÷ 100) × 100 = 10 percent
This means 10 percent of your customers churned during January.
2. Gross Revenue Churn Rate
Customer churn rate shows how many customers leave, but it does not show how much revenue you lose. Since not all customers contribute the same revenue, gross revenue churn provides deeper insight into financial impact.
This metric is especially important for SaaS and subscription based businesses that track monthly recurring revenue.
Gross Revenue Churn Rate Formula
(Revenue Lost During Period ÷ Total Revenue at Start of Period) × 100
Example
Your monthly recurring revenue at the start of September is $100,000.
During the month, you lose $5,000 in recurring revenue.
Gross revenue churn rate = (5,000 ÷ 100,000) × 100 = 5 percent
This shows that 5 percent of your revenue churned during September.
3. Adjusted Churn Rate
For fast growing businesses, basic churn formulas may not tell the full story. If you are adding many new customers while also losing some, total customer count may still increase, even though churn exists.
Adjusted churn rate accounts for growth and gives a more accurate view of customer health.
Adjusted Churn Rate Formula
(Customers Lost During Period ÷ Average Number of Customers During Period) × 100
This approach helps scaling companies understand churn without growth masking underlying retention issues. It is commonly used by high growth SaaS and subscription businesses.
4. Seasonal Churn Rate
Some businesses experience predictable changes in demand throughout the year. In these cases, seasonal churn rate helps normalize churn across peak and off peak periods.
To calculate seasonal churn, first calculate churn rates for busy and slow seasons using the customer churn formula. Then compare those periods to understand annual churn patterns.
This method is useful for industries affected by seasonality, such as travel, retail, events, or subscription services with usage spikes.
Churn Rate Examples by Industry
Churn benchmarks vary widely by industry and business model.
E-commerce churn rate
E-commerce businesses often experience very high churn due to one time purchases and intense competition. Churn rates can range from 70 to 80 percent. For example, a company with a 65.5 percent retention rate would have a churn rate of 34.5 percent.
SaaS churn rate
SaaS businesses rely heavily on subscriptions, making churn a core growth metric. Median annual gross revenue churn in SaaS is around 14 percent. Monthly churn varies by segment, with enterprise SaaS typically lower than SMB focused products.
Logistics churn rate
Logistics businesses often face high customer turnover due to pricing pressure and operational complexity. Average churn rates can reach 40 percent, making relationship management and service consistency critical.
Key Takeaway: There is no single churn formula that fits every business. Customer churn, revenue churn, adjusted churn, and seasonal churn each answer different questions. Tracking the right churn metrics gives you clarity on retention performance, revenue risk, and customer experience gaps.
Accurate churn calculation is the foundation for reducing churn, improving lifetime value, and building sustainable growth.
Customer Churn vs. Revenue Churn
To build a healthy business, you cannot just look at one number. You need to understand the difference between losing a subscriber and losing income. These are two different metrics that tell different stories about your company's health.
1. Customer Churn (Logo Churn)
Customer Churn refers to the rate at which you lose individual accounts or subscribers. It answers the simple question: "How many people left?" This metric is vital for understanding if your product satisfies the average user.
To calculate it, use this formula:
Customer Churn Rate = (Customers Lost During the Period ÷ Total Customers at the Start of the Period) × 100
Real-World Example: Imagine a streaming service like Netflix. If they start January with 1,000 users and 50 people cancel their subscription by January 31st, the customer churn rate is 5%.
2. Revenue Churn (MRR Churn)
Revenue Churn focuses on the money lost. This is often more critical for B2B (Business-to-Business) companies because not every customer pays the same amount. Losing a small client hurts less than losing a massive enterprise client.
Gross Revenue Churn Rate = (Revenue Lost from Cancellations ÷ Total Revenue at the Start of the Period) × 100
Why It Matters: Let’s say you have 100 customers. 99 of them pay $10/month, but 1 big client pays $1,000/month.
- If 5 small customers leave, your Customer Churn is 5%, but your revenue loss is small ($50).
- If that 1 big client leaves, your Customer Churn is only 1%, but you just lost half your revenue!
Key Insight: Always track both. High customer churn points to product dissatisfaction. High revenue churn points to a problem with your high-value account management.
Voluntary vs. Involuntary Churn: Knowing Your Enemy
Churn isn't always a choice. To fix the problem, you first have to know if the customer wanted to leave or if they were forced out.
Voluntary Churn (Active Cancellation)
This happens when a customer makes a conscious decision to stop paying. They click "Cancel" or call your support team to end the contract.
- The Root Causes: The product didn't solve their problem, the price was too high, they had a bad experience with support, or they switched to a competitor.
- The Fix: This requires better product features, better customer service, and stronger relationships.
Involuntary Churn (Passive Cancellation)
This is the "silent killer" of businesses. It happens when a customer's payment fails, and their subscription is cut off, even though they wanted to keep using the product.
- The Root Causes: Expired credit cards, banks flagging a transaction as fraud, insufficient funds, or outdated billing addresses.
- The Fix (Dunning Management): You need a "Dunning" strategy. This includes:
- Sending automatic emails warning customers before a card expires.
- Retrying the credit card charge 3 or 4 times on different days.
- In-app notifications asking users to update their billing info.
What Is a Good Churn Rate? (Average Benchmarks by Industry)
"Is my churn rate bad?" is a common question. The answer depends heavily on your business model and who you sell to.
1. B2C Benchmarks (Selling to Consumers)
If you sell to regular people (like Spotify, Hulu, or meal kit boxes), churn is naturally higher. Consumers are fickle and often cancel to save money.
- Average Monthly Churn: 5% – 7%
- Why: Low switching costs. It takes seconds to cancel a streaming service.
2. B2B SMB Benchmarks (Selling to Small Businesses)
Selling to small businesses carries risk because small businesses often run out of money or close down.
- Average Monthly Churn: 3% – 5%
- Why: Small businesses are price-sensitive and have high failure rates.
3. B2B Enterprise Benchmarks (Selling to Big Companies)
If you sell to Fortune 500 companies, churn should be extremely low. These contracts are often annual or multi-year.
- Average Monthly Churn: < 1% (Ideally 5-10% annually)
- Why: High switching costs. It is very hard for a big company to rip out software and replace it.
The Top Causes of Customer Churn
Customers rarely leave for no reason. Comprehensive churn analysis usually reveals one of these four core problems.
1. Poor Onboarding (The First 90 Days)
The most dangerous time for churn is the start. If a customer buys your tool but can't figure out how to use it within the first week, they will assume it is "too hard" and leave. This is called Time-to-Value (TTV). If TTV is slow, churn goes up.
2. Weak Relationship Building
In B2B, people buy from people. If a customer only hears from you when you want money (invoice time), they feel undervalued. Lack of regular check-ins or "Quarterly Business Reviews" leads to customers feeling neglected.
3. Product Bugs and Downtime
Reliability is a feature. If your software crashes, is slow, or deletes data, trust is broken. Customers will tolerate a few bugs, but chronic instability is a guaranteed way to increase churn.
4. Better Competitor Offers
Markets move fast. If your competitor releases a shiny new feature or drops their price, your customers will notice. If your product remains stagnant (doesn't improve), you become the "old" solution.
How to Conduct a Comprehensive Churn Analysis
Don't guess why people are leaving. Use data to find the truth. Here is a step-by-step framework for deep analysis.
Step 1: Cohort Analysis
Instead of looking at all customers, group them by when they signed up. This is called a Cohort Analysis.
- Example: Look at everyone who signed up in January. How many are left in February? In March? In April?
- Goal: This tells you if you are getting better at keeping customers over time. If the "January Cohort" stayed longer than the "June Cohort," you know you broke something in June.
Step 2: Exit Surveys
When a user clicks cancel, ask them why. Keep it simple—a multiple-choice question is best.
- "Too expensive"
- "Missing features"
- "Switched to another service"
- "Customer support issues"
Step 3: Segment by Plan
Analyze churn by pricing tier.
- Are your "Pro Plan" users staying longer than your "Basic Plan" users? If so, your Basic Plan might be attracting low-quality leads who aren't a good fit for your product.
Proven Strategies to Reduce Customer Churn
Reducing churn requires a mix of marketing, product improvements, and support tactics.
1. Focus on "Sticky" Features
Identify the features that make your product hard to leave. For a project management tool, this might be "uploading files." Once a customer has all their files in your system, leaving becomes a hassle. Encourage users to use these sticky features early on.
2. Offer Annual Upgrades
Customers on monthly plans have 12 chances a year to quit. Customers on annual plans have only one. Move customers to annual contracts by offering a discount (e.g., "Get 2 months free if you pay annually"). This instantly reduces churn for the next 12 months.
3. The "Save" Offer
When a user tries to cancel, offer a last-minute incentive to stay. This could be a discount, a free month, or a pause option.
- Example: "Instead of canceling, would you like to pause your account for 3 months for free?" This keeps the account alive.
4. Build a Community
Create a Facebook group, Slack channel, or forum for your users. When customers make friends in your community or get advice from other users, they develop an emotional connection to your brand.
The Role of Customer Success in Retention
Customer Success (CS) is not the same as Customer Support. While Support fixes bugs, Success helps customers grow.
Proactive vs. Reactive
- Support: Waits for the phone to ring. "Hello, how can I fix your problem?"
- Success: Calls the customer first. "Hello, I noticed you aren't using our new feature. Let me show you how it can save you time."
Quarterly Business Reviews (QBRs)
For high-value clients, a Customer Success Manager should hold a meeting every three months. In this meeting, they show data proving the value the product has provided.
- Script: "In the last 90 days, our software saved your team 400 hours of work. Here is the plan for the next 90 days."
This reminds the customer why they pay you, making it very hard for them to cancel.
How to Predict Customer Churn Before It Happens
The holy grail of retention is stopping churn before the customer decides to leave. You can do this by tracking "Health Scores."
1. Engagement Metrics
Track how often users log in. If a daily user suddenly drops to logging in once a week, they are "slipping away."
- Action: Trigger an automated email: "We miss you! Here is a tip to get back on track."
2. The "Champion" Leaves
In B2B sales, usually one person (the Champion) loves your product and bought it for the company. If you see on LinkedIn that this person has left their job, churn risk is 100%. The new person might bring in their own preferred software.
- Action: Contact the new replacement immediately and train them on your product.
3. NPS (Net Promoter Score) Drops
Send out regular surveys asking users to rate you from 1-10. If a user who usually gives you a '9' suddenly gives you a '6', something is wrong. Reach out personally to ask what changed.
4. Support Ticket Volume
Monitor the type of tickets. A customer asking "How do I export my data?" is likely preparing to leave. A customer asking "How do I upgrade?" is happy. Set up alerts for keywords like "export," "cancel," or "contract" in your support emails.
Conclusion
Customer churn is more than a number on a dashboard. It reflects how well your business delivers value and keeps customer trust.
High churn drains revenue and slows growth. It forces sales and marketing teams to focus on replacement instead of expansion. Over time, this makes growth expensive and unpredictable.
By understanding how churn works, using the right churn formulas, and tracking both customer churn and revenue churn, teams gain clear visibility into retention and revenue risk. This clarity makes it easier to improve onboarding, pricing, customer experience, and go to market execution.
Reducing churn changes the growth curve. Customers stay longer, expand more, and generate predictable revenue. For B2B and SaaS businesses, sustainable growth comes from retention first, acquisition second. When churn is controlled, growth compounds instead of resetting.