Table of content

SMARTe GTM Intelligence
Start Smarter Prospecting Today
TL;DR:
RevOps KPIs and metrics help B2B companies measure pipeline health, forecasting accuracy, sales efficiency, customer retention, and overall revenue performance. The best RevOps teams focus on actionable metrics that identify revenue leaks, improve GTM alignment, and create predictable growth.
- RevOps KPIs measure revenue performance across sales, marketing, and customer success.
- Leading indicators like pipeline velocity and speed to lead predict future revenue performance.
- Pipeline velocity is one of the most important RevOps metrics in 2026.
- Stage-to-stage conversion rates reveal where deals drop in the sales funnel.
- MQL-to-SQL conversion measures marketing and sales alignment.
- Win rate, sales cycle length, and ACV track sales efficiency and pipeline quality.
- NRR, GRR, and expansion revenue rate measure customer retention and account growth.
- Forecast accuracy depends heavily on clean CRM data and updated pipeline records.
- CRM data health is now a critical board-level RevOps KPI.
- AI forecasting and automation tools only work effectively with accurate, real-time B2B data.
- The best RevOps dashboards prioritize actionable metrics over vanity reporting.
- Companies should track different RevOps KPIs depending on their growth stage and GTM maturity.
RevOps KPIs and metrics help revenue teams measure the health of the entire revenue engine, from lead generation to closed revenue and customer retention. The goal is not to track more metrics. The goal is to track the right ones that improve forecasting, pipeline efficiency, sales performance, and revenue growth.
Most companies track too many disconnected numbers across marketing, sales, and customer success. This creates reporting noise, inconsistent decisions, and poor visibility into what is actually driving revenue. Strong RevOps teams focus on a smaller set of KPIs that clearly show where the funnel is performing well and where revenue leaks exist.
In this guide, you'll learn the most important RevOps KPIs and metrics to track in 2026, what each metric means, industry benchmarks, common reporting mistakes, and how to build a more reliable revenue measurement framework.
What RevOps KPIs Actually Measure
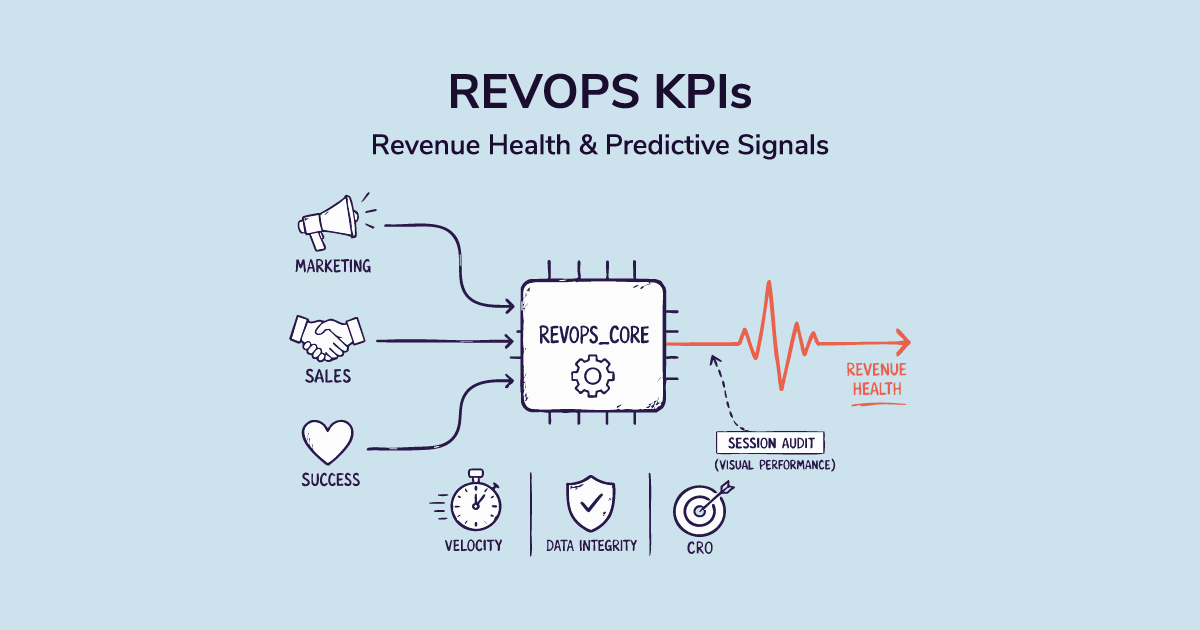
RevOps KPIs are different from departmental metrics. Sales tracks close rate. Marketing tracks MQL volume. Customer success tracks NPS. Each of those optimises one team's performance in isolation. RevOps KPIs track what happens between those teams, and the sum of all three.
Honestly, the most useful framing I've found: a departmental metric tells you how one team is performing. A RevOps KPI tells you where revenue is leaking in the handoffs between them.
Why Most RevOps Dashboards Are Built Backwards
Most dashboards are built almost entirely from lagging indicators. Revenue, churn, win rate, quota attainment. These tell you what already happened.
By the time a lagging indicator moves badly enough to show up on a dashboard, you've already lost the quarter.
Leading indicators are the ones that give you warning. Pipeline velocity, stage-by-stage conversion rates, speed to lead, MQL-to-SQL rate. These tell you what's about to happen. A meaningful drop in lead-to-opportunity conversion this week predicts a thin pipeline in 60 to 90 days. You have time to respond.
The best RevOps dashboards blend both but weight leading indicators more heavily for the weekly ops view. Save the lagging indicators for the executive layer and the quarterly review. If your Monday morning dashboard is all lagging, you're reading last month's news and calling it insight.
SMARTe GTM Intelligence
Start Smarter Prospecting Today
The 20 RevOps KPIs Worth Tracking in 2026
Pipeline and Funnel Metrics
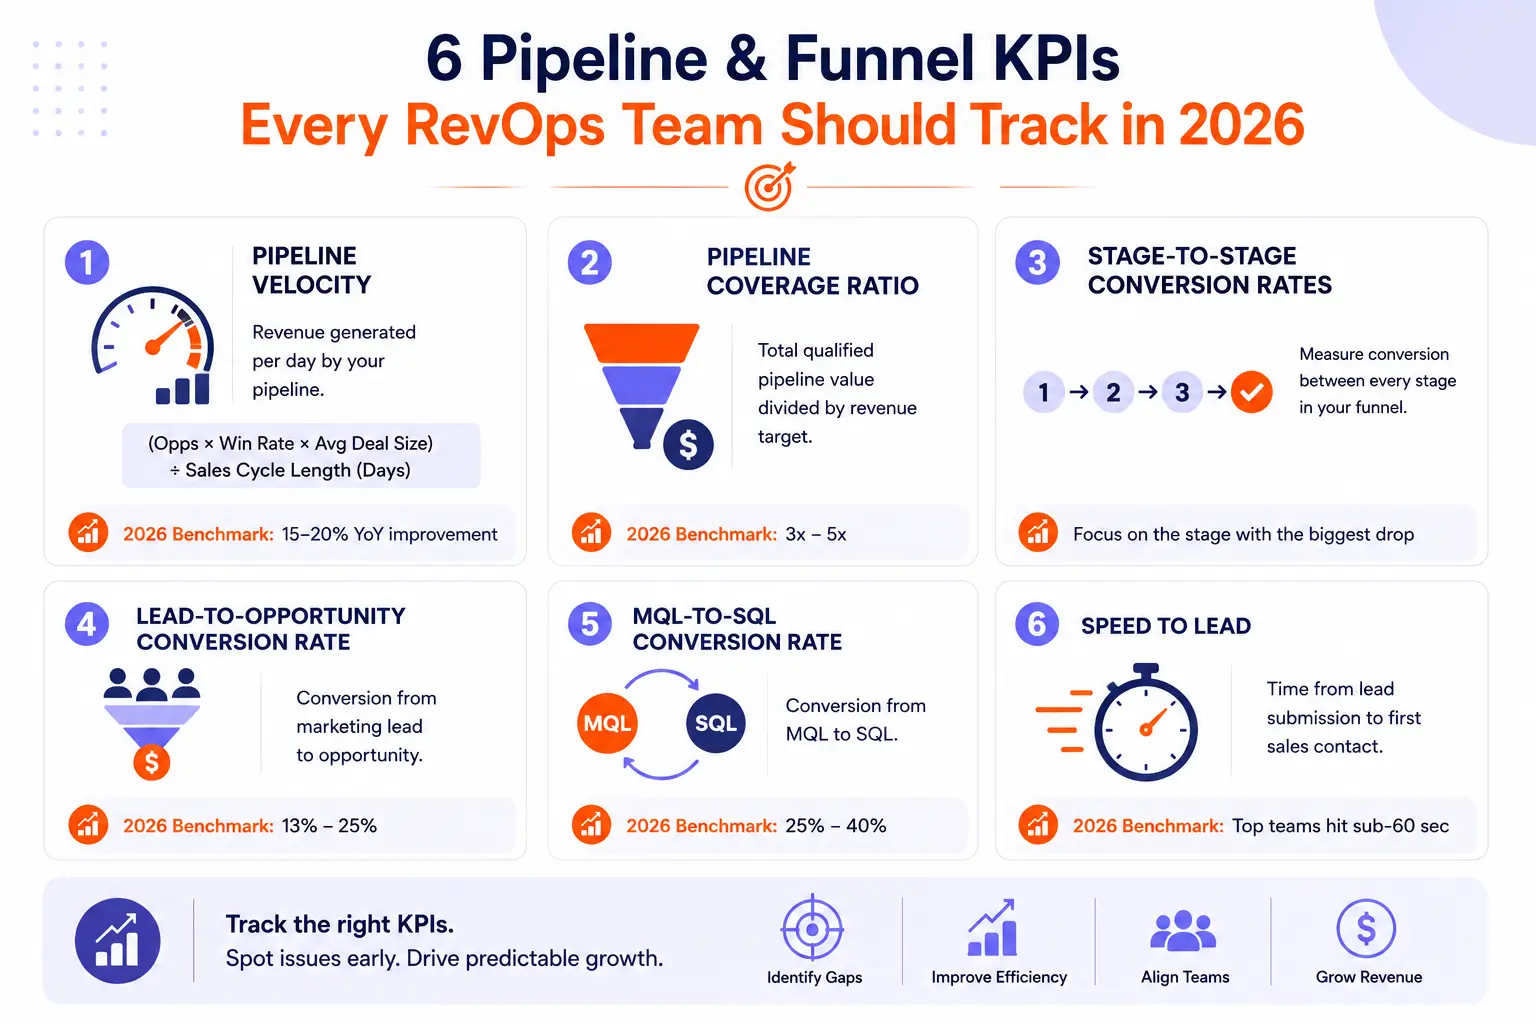
1. Pipeline Velocity
The single most diagnostic metric in RevOps. Pipeline velocity tells you how much revenue your pipeline generates per day by combining four inputs into one number.
Formula: (Number of Opportunities x Win Rate x Average Deal Size) / Sales Cycle Length in Days.
When velocity drops, RevOps can isolate exactly which input caused it. Fewer opportunities points to a top-of-funnel problem. A falling win rate points to ICP or competitive issues. A shrinking average deal size means the team is chasing smaller accounts or discounting too aggressively. A lengthening cycle usually means something is stalling in evaluation or procurement.
Track this weekly. A monthly cadence means you're catching the problem eight to twelve weeks too late.
2026 benchmark: Healthy B2B SaaS teams see 15 to 20% velocity improvement year over year. Flat velocity is a warning sign even when revenue holds steady. You're working harder for the same output.
2. Pipeline Coverage Ratio
Total qualified pipeline value divided by revenue target. The old "3x coverage" rule came from high-velocity SaaS with short cycles and predictable win rates. It doesn't apply to most enterprise motion in 2026.
If your average sales cycle is over 90 days or your win rate sits below 25%, you need closer to 4x to 5x coverage. Use your own historical close data to calculate the right ratio. Don't borrow benchmarks from a company whose business model looks nothing like yours.
2026 benchmark: 3x to 5x depending on cycle length and win rate. Wild swings in coverage from week to week usually indicate inconsistent lead generation, not a pipeline problem.
3. Stage-to-Stage Conversion Rates
This is the metric most teams skip and the one that tells you the most. Don't just track top-of-funnel and bottom-of-funnel conversion. Measure how many opportunities move from Stage 1 to Stage 2, Stage 2 to Stage 3, and so on through close.
The stage with the largest conversion drop is your single biggest improvement opportunity. In most B2B SaaS companies, that stage is Stage 2 to Stage 3: initial interest to serious evaluation. Deals die here quietly. Nobody flags them for 60 days. RevOps needs to see this in real time.
A 5-point improvement in Stage 2 to Stage 3 conversion typically has more revenue impact than any other single intervention. That's why tracking it matters.
4. Lead-to-Opportunity Conversion Rate
The handoff metric between marketing and sales. When it drops, the first question is always whether it's a qualification problem or a response time problem. Usually both.
Track by source. A content-driven lead converting at 8% and a demo-request lead converting at 40% need completely different workflows. Averaging them hides both the opportunity and the gap.
2026 benchmark: 13 to 25% depending on source and segment.
5. MQL-to-SQL Conversion Rate
Marketing and sales fight about this number constantly. Sales says the leads are bad. Marketing says sales isn't following up. RevOps owns the definition of both MQL and SQL, which means RevOps owns this number and the accountability for when it moves.
When this rate is too low, sales is ignoring marketing leads. When it's too high, the qualification bar is so strict that marketing can't hit volume targets. The right number sits somewhere both teams feel the friction.
2026 benchmark: 25 to 40% per The RevOps Report's 2026 dataset. If yours sits below 20%, the most common cause is a misaligned definition of qualified, not bad leads or bad reps.
6. Speed to Lead
Time from lead submission to first sales contact. Research consistently shows this is the single biggest predictor of inbound conversion. Not message quality. Not the rep's experience. Response time.
The 2026 benchmark has moved significantly. The old target was under 5 minutes. Top-quartile teams using instant booking tools like Chili Piper and LeanData are now hitting sub-60 seconds for high-intent leads. Companies not using instant booking are now measurably behind on a metric that directly drives pipeline conversion.
If your average speed to lead for inbound demo requests is over 30 minutes, you're losing deals before the conversation starts.
Revenue and Sales Efficiency Metrics
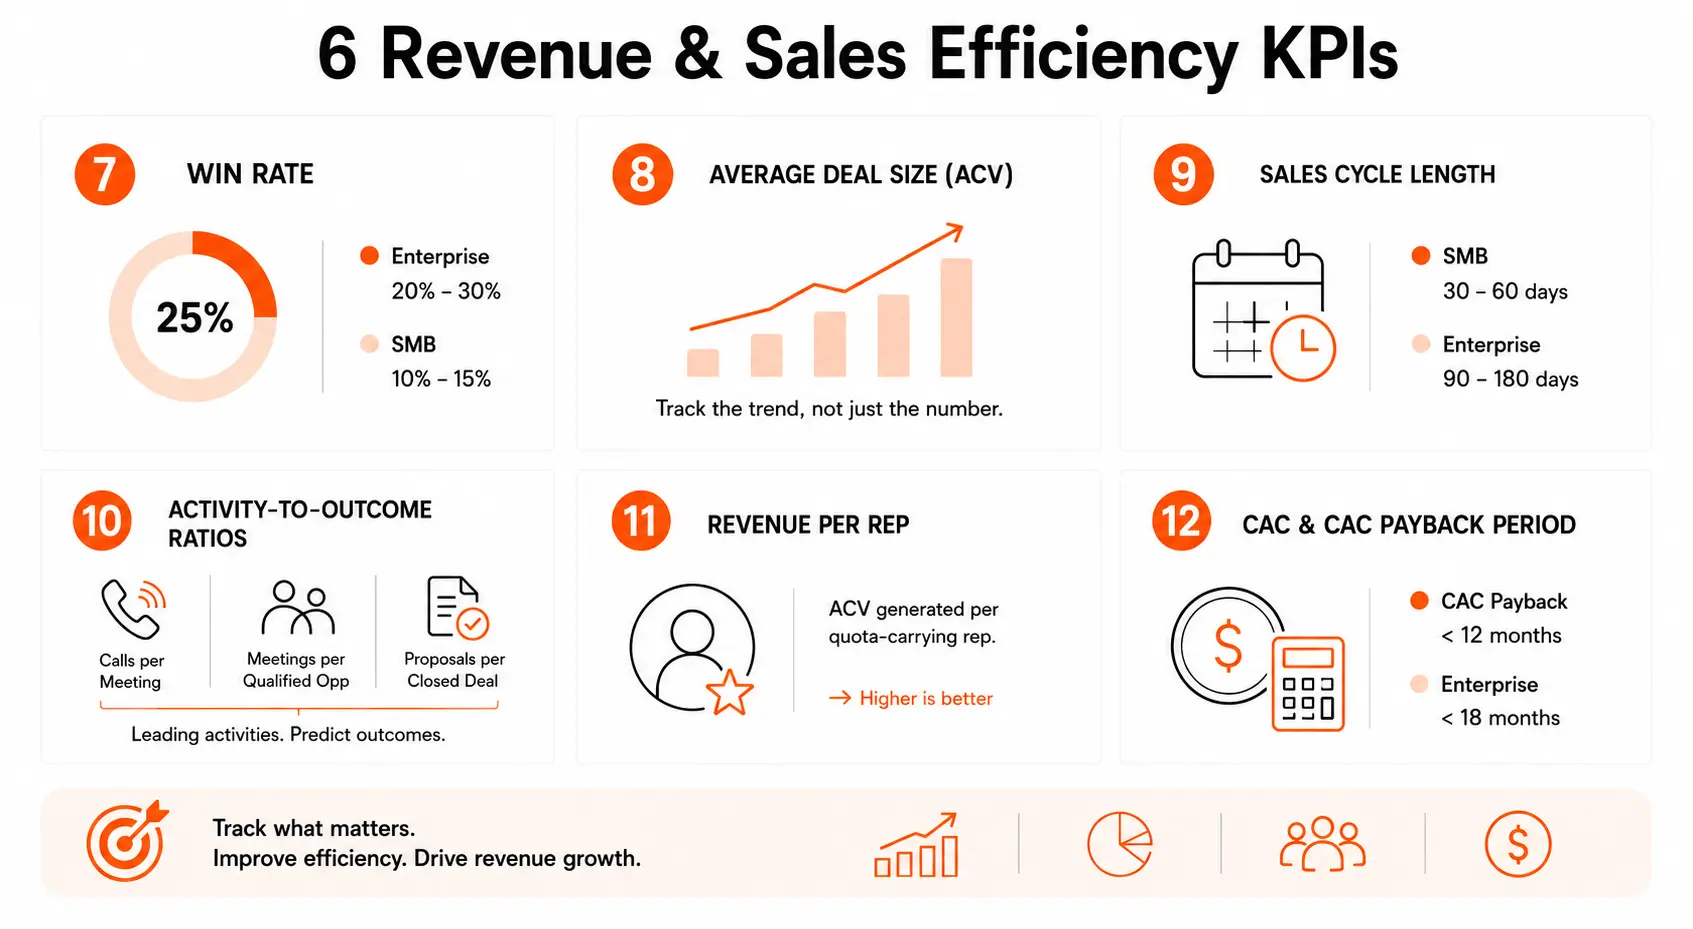
7. Win Rate
Closed-won deals divided by total closed deals. Exclude stale or disqualified opportunities from the denominator. They inflate the number and make your team feel better than the data actually supports.
Segment your win rate by rep, segment, deal size, and source. An overall win rate of 25% looks fine until you break it down and find enterprise deals close at 12% and SMB closes at 38%. Those aren't the same problem.
2026 benchmarks: 20 to 30% for enterprise SaaS. 10 to 15% for high-volume SMB motion.
8. Average Deal Size (ACV)
Track the trend, not just the number. Rising ACV with a stable win rate means the team is moving successfully upmarket. Rising ACV with a falling win rate means the team is chasing deals they can't close.
When ACV drops, the first question is whether it's intentional (a new SMB motion) or symptomatic (reps are shying away from enterprise conversations). These need different responses.
9. Sales Cycle Length
Days from opportunity creation to close. Track by segment, not just overall. One large enterprise deal can move the average by weeks and create a false sense that cycles are lengthening across the board.
A cycle that's getting longer without a corresponding increase in deal size is usually signalling one of three things: more decision-makers getting added to the buying process, procurement requirements getting stricter, or competitive deals where the prospect is using the evaluation process to negotiate.
2026 benchmarks: 30 to 60 days for SMB. 90 to 180 days for enterprise.
10. Activity-to-Outcome Ratios
Calls per booked meeting, meetings per qualified opportunity, proposals per closed deal. These bridge leading activity metrics to lagging revenue outcomes.
When the ratios shift, you catch problems before they hit the forecast. If your reps are making the same number of calls but booking fewer meetings, something changed in the outreach or the data underneath it. RevOps identifies which one.
11. Revenue Per Rep
Annual contract value divided by the number of quota-carrying reps. Compare it against fully loaded rep compensation. If a rep's OTE is $150,000 and they're generating $350,000 in ARR, the economics are tight but workable. At $180,000 ARR, the math doesn't scale.
In my experience, when revenue per rep falls without a headcount explanation, the first thing to check is data quality. Reps working stale prospect lists, dialling disconnected numbers, and emailing churned contacts are wasting 20 to 30% of their productive time before a single conversation happens.
12. CAC and CAC Payback Period
CAC is total sales and marketing spend divided by new customers acquired. Include everything: salaries, tools, events, content. RevOps is the only function that sees the full cost picture across marketing and sales, which makes it uniquely suited to calculate this accurately.
CAC payback period is how many months it takes to recover the acquisition cost from a customer's revenue. Track both. A high CAC is fine if NRR is strong and the contract is long. It's a serious problem if customers churn at month 14 and the payback period was 16 months.
2026 benchmark: CAC payback under 12 months for most B2B SaaS. Under 18 months is acceptable for enterprise motion with strong NRR.
Retention and Expansion Metrics
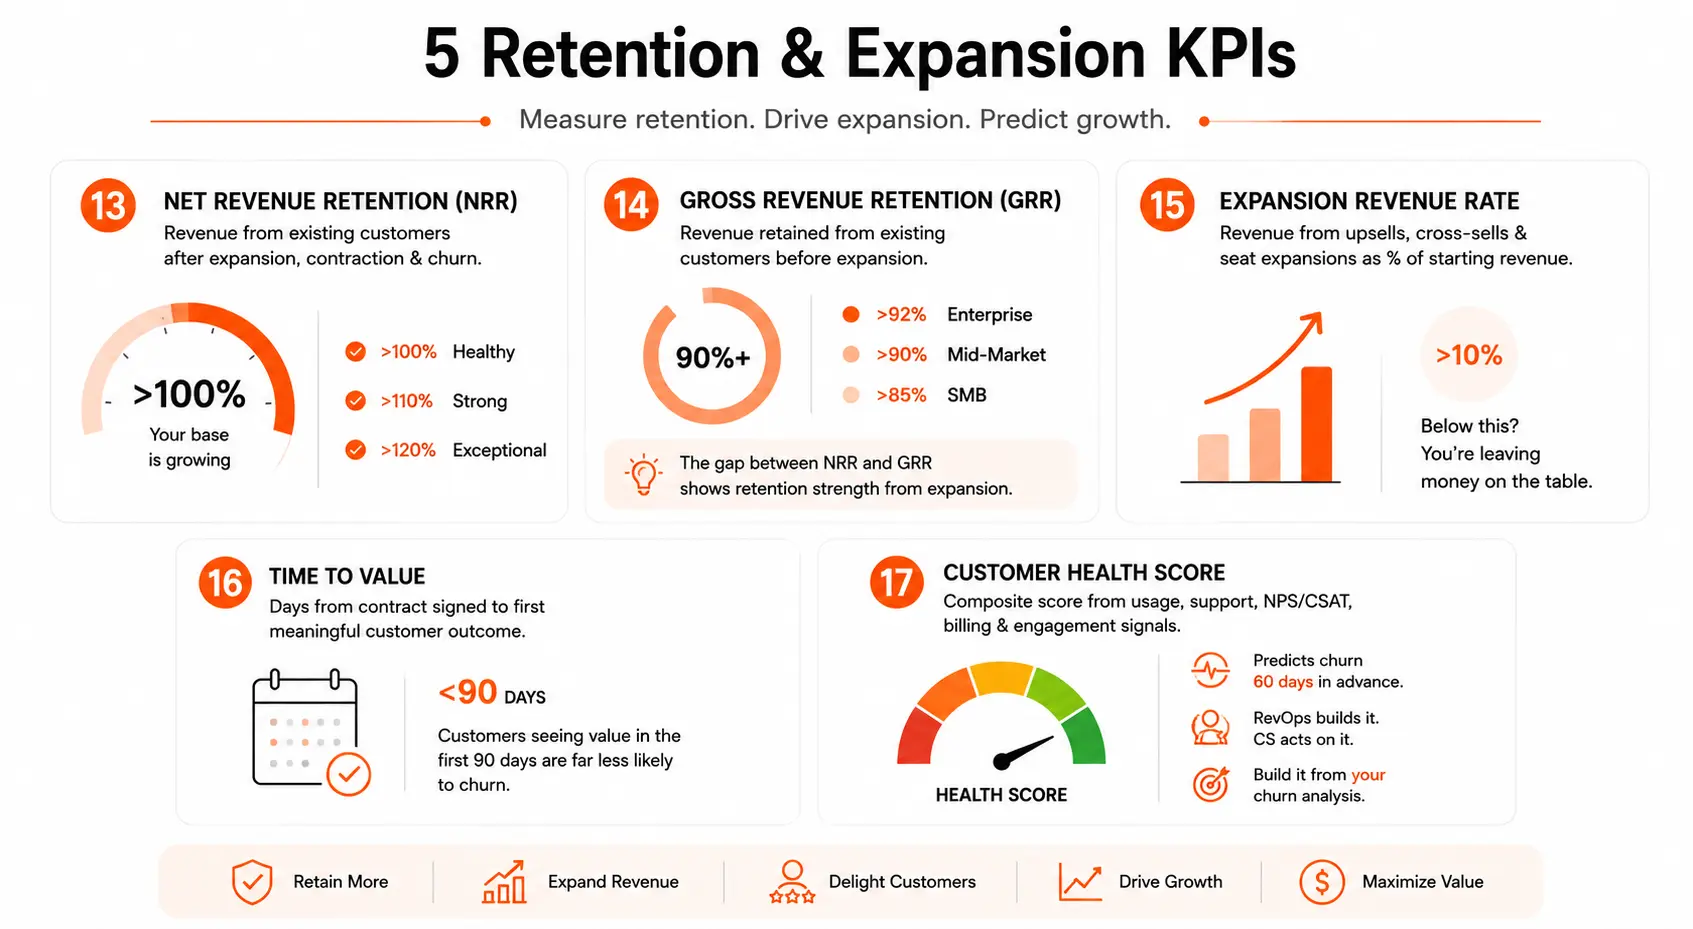
13. Net Revenue Retention (NRR)
Revenue from existing customers after accounting for expansion, contraction, and churn. NRR above 100% means your existing base is growing without a single new logo. This is the metric VCs and boards care about most, because it tells them whether the business compounds or runs in place.
Below 100% means churn and contraction are outpacing expansion. Every point below 100% means new business is just covering losses, not driving growth.
2026 benchmarks: Above 100% is healthy. Above 110% is strong. Above 120% is exceptional and usually only achieved by product-led businesses with strong expansion pricing.
14. Gross Revenue Retention (GRR)
Revenue retained from existing customers before expansion. Always lower than NRR. The gap between NRR and GRR tells you where your retention strength comes from.
High NRR with low GRR means expansion is masking a churn problem. That's a fragile position. One slow expansion quarter and the revenue picture deteriorates fast. GRR is the honest number.
2026 benchmarks: Above 85% for SMB. Above 90% for mid-market. Above 92% for enterprise.
15. Expansion Revenue Rate
Revenue from upsells, cross-sells, and seat expansions as a percentage of starting revenue. If your expansion rate is below 10% annually, there's money being left in your existing accounts.
This metric bridges customer success and RevOps. CS owns the relationships. RevOps owns the data that shows which accounts have expansion potential and whether the upsell motion is working systematically.
16. Time to Value
Days from contract signed to customer achieving their first meaningful outcome. This is the metric that predicts churn before it's visible in retention numbers.
Customers who don't see results in the first 90 days are significantly more likely to churn at renewal. Time to Value is a leading indicator for GRR, which makes it one of the more valuable post-sale metrics RevOps can own.
Track it by segment and by CS rep. Long time to value in a specific segment often traces back to an onboarding gap, a product gap, or a sales promise that CS can't deliver on.
17. Customer Health Score
A composite score combining product usage, support tickets, NPS or CSAT, billing status, and engagement signals. RevOps builds the model. CS acts on it. The most useful health scores predict churn 60 days out, which gives CS enough time to actually do something about it.
Build it from the signals that actually correlate with churn in your specific business. In my experience, generic health score templates built from industry averages measure the wrong things for most companies. A health model built from generic industry templates often measures the wrong things. Run a churn analysis first. Find out what churned customers did differently from customers who stayed. Build the model around those signals.
Operational and Data Quality Metrics
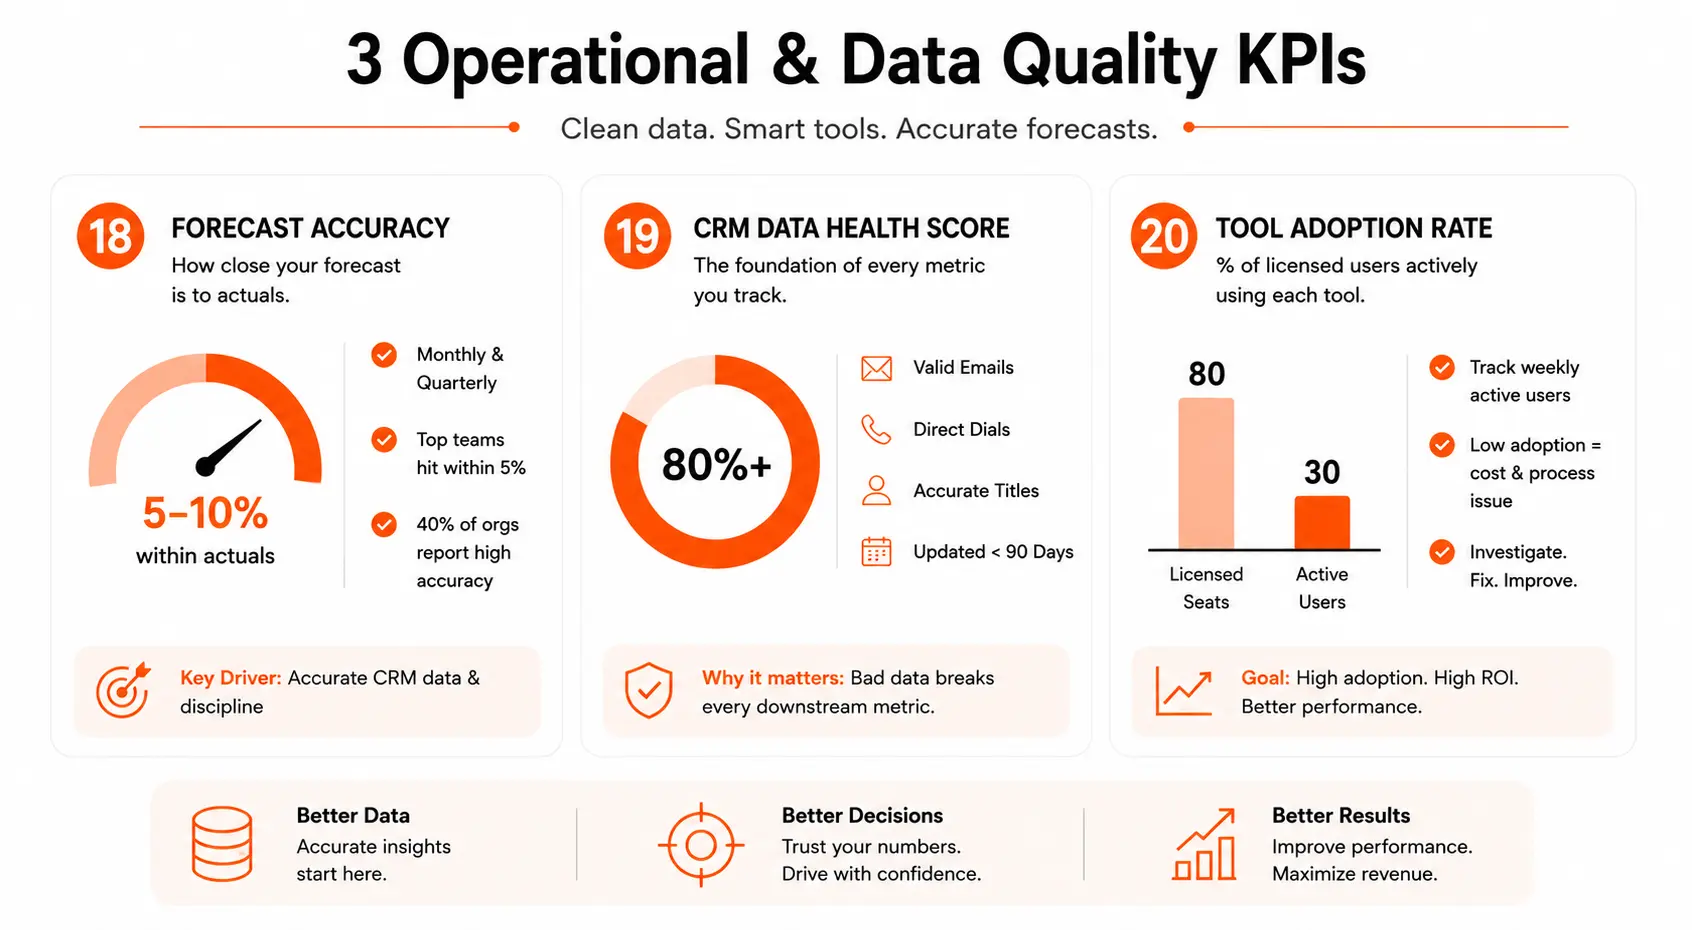
18. Forecast Accuracy
How close is the revenue forecast to actual results? The benchmark is within 5 to 10% of actuals at both monthly and quarterly levels.
Only 40% of organisations report high forecast accuracy. The primary cause is almost never methodology. It's CRM data. Opportunities sit open too long. Deal stages don't reflect reality. Close dates get pushed without updating probability. RevOps owns the discipline that prevents this, which means RevOps owns forecast accuracy even when the forecast is built by sales leadership.
Sales forecasting software improves accuracy when the pipeline data feeding it is current. A sophisticated forecasting model built on stale pipeline produces a more confident wrong number, not a correct one.
2026 shift: Top-quartile B2B SaaS teams are now hitting within 5% accuracy (tighter than the previous 10% benchmark) because AI-powered forecasting tools like Clari and Aviso are generating meaningfully better predictions than spreadsheet roll-ups. If you're still on manual forecasting, the accuracy gap versus top-quartile is widening.
19. CRM Data Health Score
What percentage of active contact records have valid emails? How many direct dials are current? What percentage of accounts have accurate decision-maker titles? How many records haven't been updated in over 90 days?
If this score sits below 80%, every other metric on your dashboard is partially unreliable. Pipeline velocity reflects opportunities with wrong contacts. Win rate calculations include dead opportunities. Bad CRM data doesn't just waste outreach effort. It corrupts every downstream metric that RevOps reports on.
Research from Prospeo puts 46.51% of RevOps time on manual data cleansing. Nearly half the function's bandwidth, spent fixing the foundation instead of operating on top of it.
2026 shift: CRM data health became board-reportable in 2025 after repeated forecast misses traced back to data quality failures. Leading RevOps teams now track it as a standard monthly KPI alongside pipeline metrics, not as a quarterly hygiene task.
20. Tool Adoption Rate
The percentage of licensed users actively using each tool in the revenue stack. If you're paying for 80 seats of a sales intelligence platform and 30 reps log in monthly, that's a significant budget problem and a process problem.
Track weekly active users for every per-seat tool. When adoption drops, RevOps investigates whether it's a usability issue, a workflow integration issue, or a "nobody told the team why this tool matters" issue. Each has a different fix.
Common RevOps Metric Mistakes
- Tracking vanity metrics. Total pipeline created sounds good in an all-hands. But if 60% of it is unqualified, you're celebrating the wrong thing. Every metric should be weighted by quality, not just volume.
- No context on any number. "Win rate is 22%" drives no action. "Win rate is 22%, down from 26% last quarter, with the drop concentrated in enterprise deals in the healthcare vertical" drives a specific response. Metrics without trend, segment, and competitive context are reporting, not revenue operations.
- Lagging-only dashboards. If every KPI you track is a result, you're driving by looking in the rearview mirror. Blend in leading indicators at every layer of the dashboard.
- Missing the distribution. An average quota attainment of 80% can hide that 30% of reps are at 120% and 40% are at 50%. The distribution tells the real story. An average buries it.
- Owning metrics without owning the definitions. If RevOps tracks MQL-to-SQL but marketing and sales have different working definitions of both terms, the metric is measuring noise. Own the definition before tracking the number.
How to Build Your RevOps Dashboard by Company Stage
Not every company should track all 20. The right metrics depend on what you're trying to learn.
- Seed and early Series A (under $5M ARR): Pipeline velocity, win rate, sales cycle length, CAC, and speed to lead. You're still learning what works. Five metrics are enough.
- Series B and C (growth stage): Add forecast accuracy, NRR, MQL-to-SQL conversion, stage-by-stage conversion rates, and CRM data health score. You're scaling what works and need to catch process failures before they compound.
- Series D and beyond: Full coverage including tool adoption, process compliance, time to value, customer health score, expansion revenue rate, and activity-to-outcome ratios. You're optimising the machine. Every inefficiency is expensive at scale.
One rule applies at every stage: every metric needs an owner, a target, and a defined action when it moves outside its acceptable range. If a KPI doesn't trigger a specific response when it breaks, cut it from the dashboard.
What Changed in 2026 That Affects These Metrics
A few shifts this year changed how the best RevOps teams measure and operate.
- Buying group metrics became standard. Enterprise teams running account-based motions now track buying-group-level KPIs alongside lead-level metrics. Committee qualification rate (how many required stakeholders have engaged), multi-stakeholder engagement depth, and account-level conversion rates matter in complex sales. The shift requires CRM data model updates that most teams haven't made yet.
- AI forecasting tightened the accuracy benchmark. Top-quartile teams now forecast within 5% of actuals rather than the prior 10% benchmark, because AI-assisted forecasting tools produce meaningfully better predictions when fed clean data. Teams still on spreadsheet roll-ups are falling further behind.
- Speed to lead became near-instant. The 5-minute benchmark from 2023 is now the median, not the top quartile. The best teams hit sub-60 seconds via instant booking tools. This is a process change, not a headcount change, and it directly affects conversion from high-intent inbound.
- Data quality became a board-level conversation. After repeated forecast failures traced back to CRM data problems across the industry, CRM data completeness and accuracy are now standard monthly KPIs in leading RevOps teams, not quarterly hygiene reviews.
The Problem Underneath Every Metric
Here is what most RevOps KPI guides don't say.
Every single metric in this guide depends on accurate contact and account records. Pipeline velocity is calculated from open opportunities, but if the contacts inside those opportunities have changed roles, the pipeline numbers don't reflect real buyers. Win rate is calculated from closed deals, but if lost deals get buried as "stale" rather than marked closed-lost, the win rate looks better than it is.
B2B contact data decays at roughly 22.5% per year. One in five records in your CRM is wrong right now. Every metric built on those records inherits that error.
Buying signals fire on contacts who left the account. AI-ready B2B data discussions are happening precisely because AI tools run on contact records, and AI running on stale records produces confident wrong outputs at scale. The CRM data health score matters more in 2026 than it ever has, because more systems depend on that data than ever before.
Running CRM data enrichment against your active accounts before building a RevOps dashboard isn't maintenance. It's the prerequisite for having a dashboard worth trusting.
SMARTe's 283M+ verified contacts run through real-time verification, not a quarterly batch. The 90%+ CRM match rate and 60%+ reduction in RevOps manual work are both outcomes of operating on data that's current when a metric fires, not data from six months ago that happens to still be in the system.
Start With Three Metrics
If you're building a RevOps function from scratch or inheriting a broken one, start here. Pick three: pipeline velocity, win rate, and CRM data health score.
Pipeline velocity tells you whether the revenue engine is moving. Win rate tells you whether the opportunities in it are real. CRM data health tells you whether either of those numbers is worth trusting.
Get those three right. Everything else is built on them.
Your go-to-market strategy can be precise and well-executed. But it runs on data. Build the data layer first, then build the dashboard on top of it.
Try SMARTe free and see what your RevOps metrics look like when the contact data underneath them is actually verified.