
TL;DR:
An ideal customer profile (ICP) is an account-level description of the companies that buy fastest, stay longest, and cost the least to serve. It describes a company, not a person.
- An ICP filters accounts. A buyer persona describes the people inside them. Build the ICP first.
- A complete profile has five layers: firmographic, technographic, situational, buying group, and economic. Stopping at layer one gives you a census filter.
- Build it from accounts that renewed and expanded, not from everyone who signed.
- Your disqualifiers do more work than your criteria. Write them down and let reps apply them without asking.
- One test proves it: in-profile win rate against out-of-profile win rate. No gap means the profile predicts nothing.
- Rebuild on triggers, not on a calendar.
An ideal customer profile is the account-level definition of which companies you sell to and which you walk away from. Get it right and every decision downstream gets easier. Get it wrong and you fund a year of outbound into companies that were never going to buy.
Plenty of teams have a document called an ICP. Far fewer have one a rep uses on Monday morning. The gap is not length. It's whether the profile came from evidence or from a whiteboard at an offsite.
Below: what belongs in an ICP, how to build one from data you already own, and how to prove it works.
What is an ideal customer profile?
An ideal customer profile describes the type of company that gets the largest result from your product and returns the largest result to you. Not the company that might buy. The one that buys, succeeds, renews, and expands.
It works at account level, which means it answers exactly one question: should we be in this account at all?
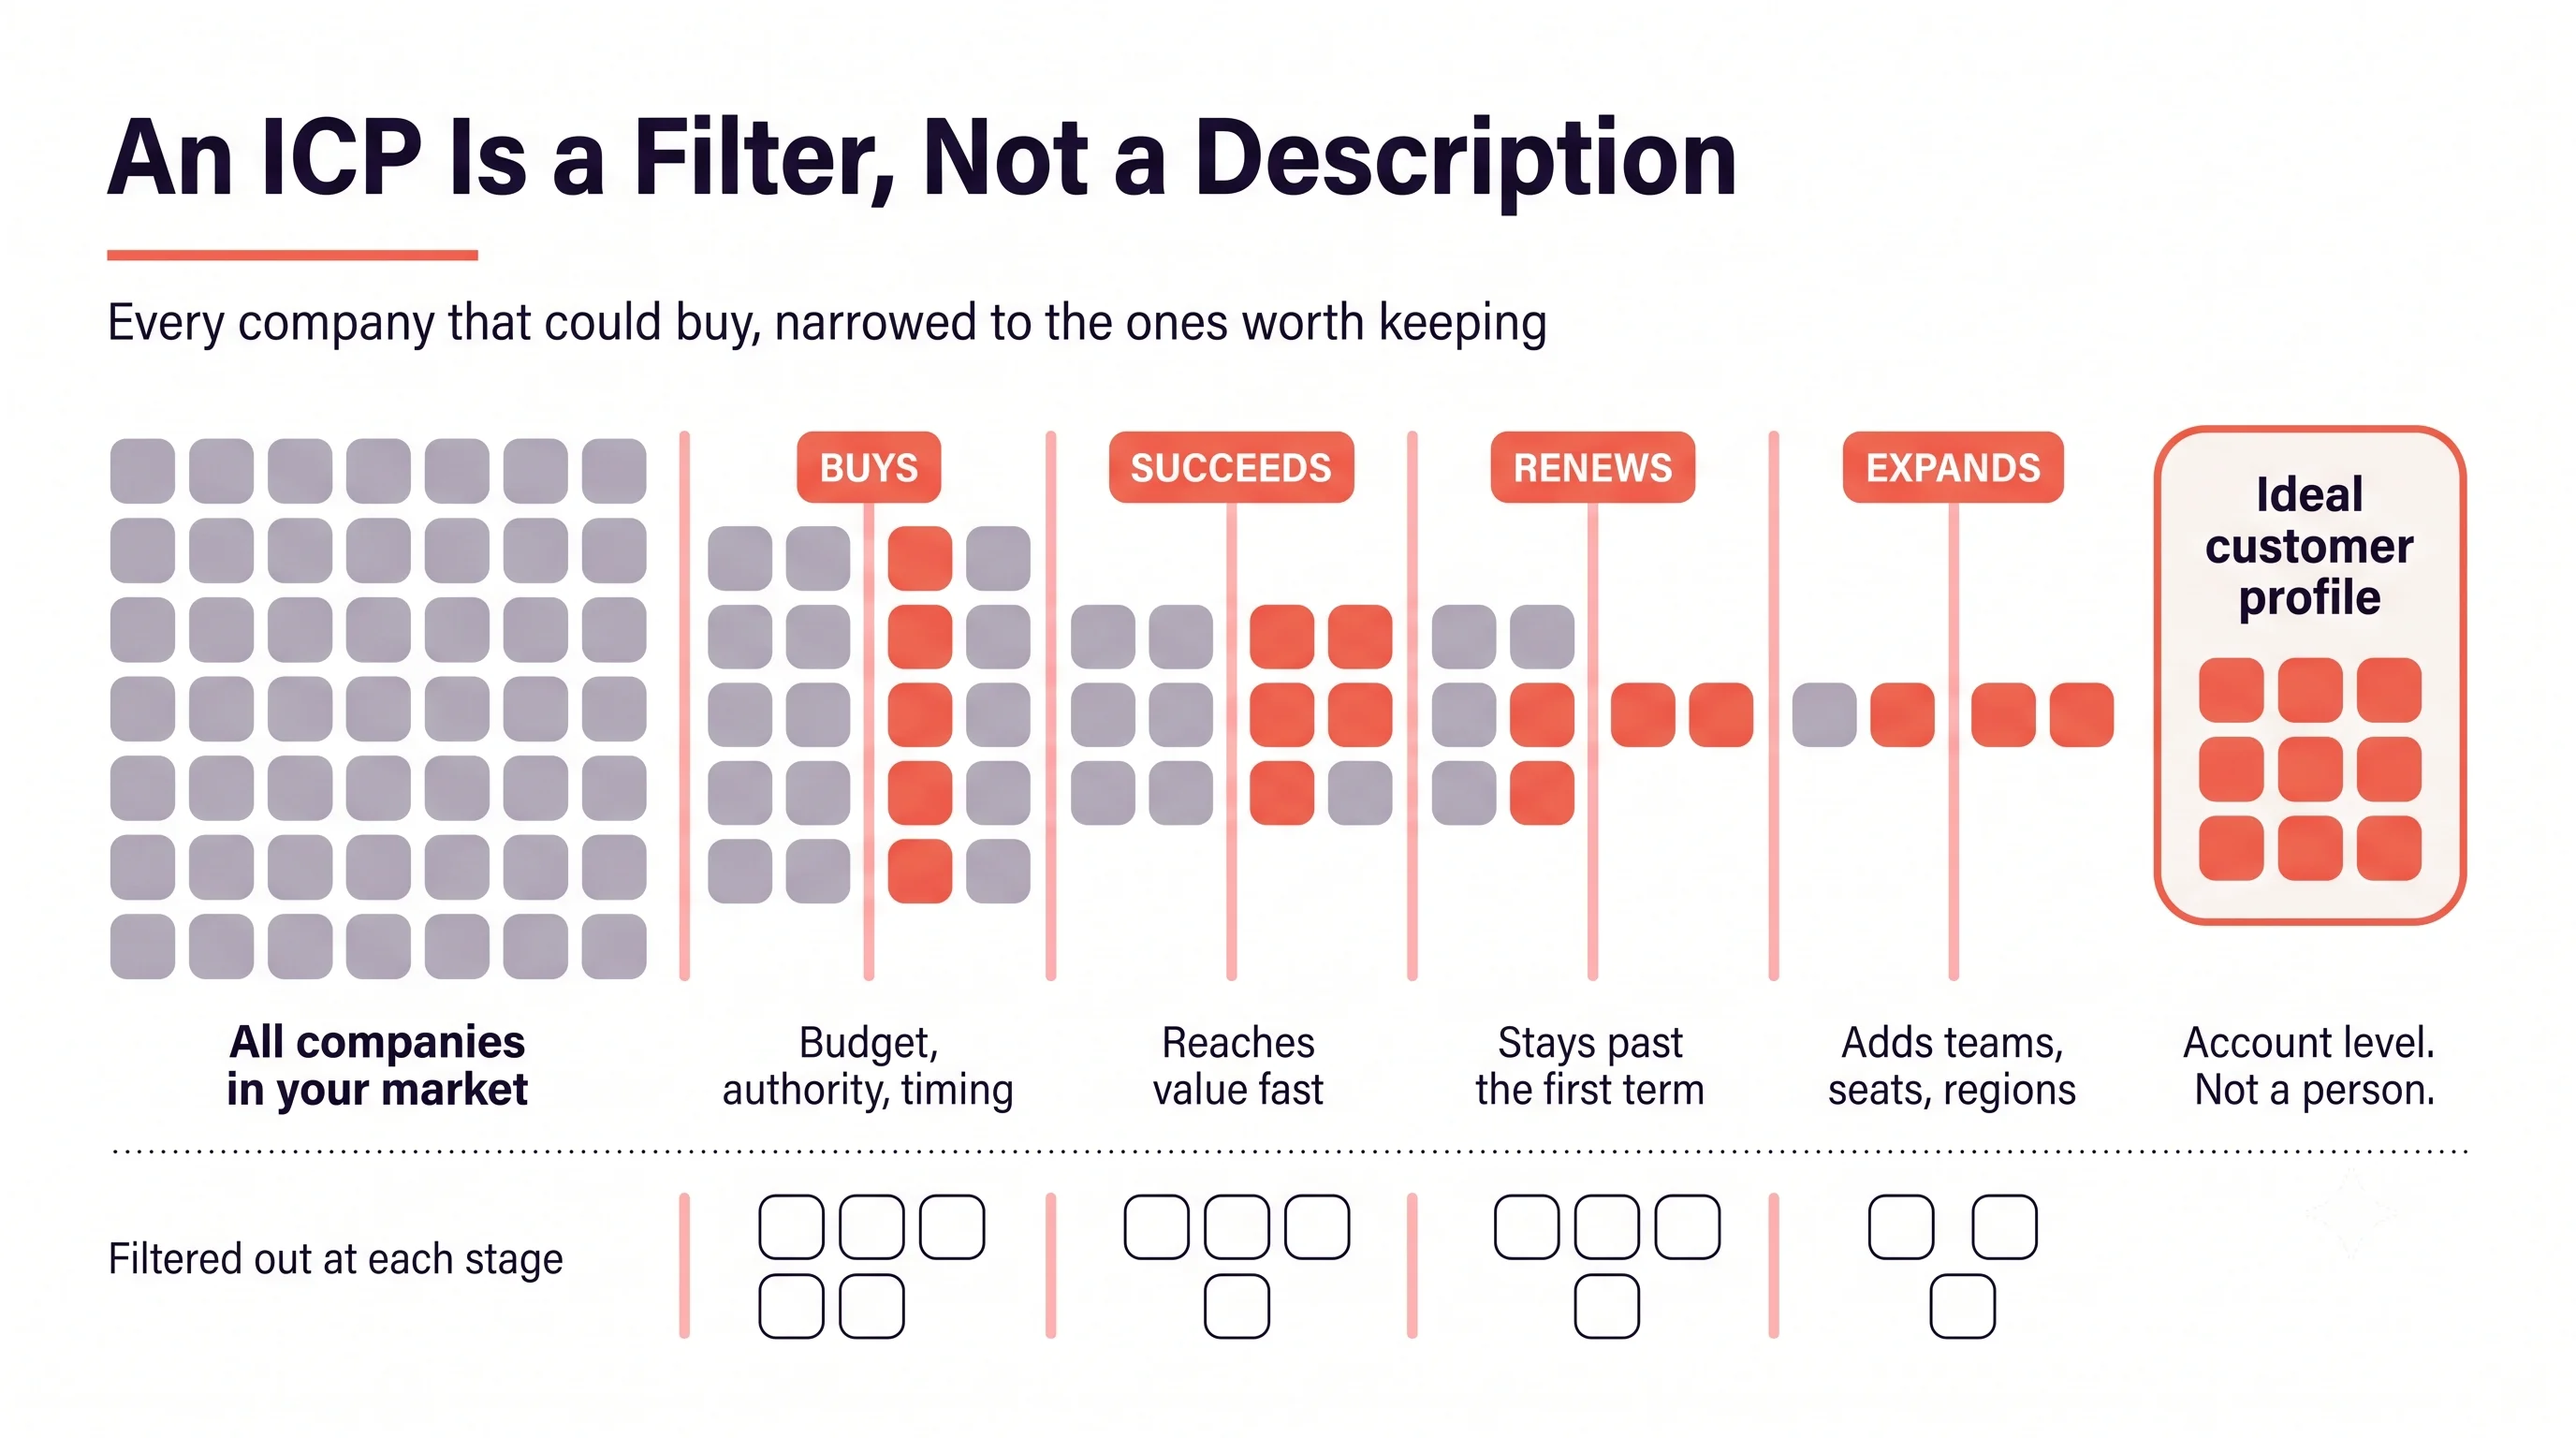
The word "ideal" carries weight too. A profile is a filter, not a portrait of your customer base. Half your current customers probably sit outside it. That's normal, and pretending otherwise is how profiles get watered down until they describe everybody.
Why the profile decides more than your target list
An ICP looks like a marketing artifact. It behaves like a constraint on the whole company.
It quietly controls:
- Outbound lists. Every B2B prospecting sequence starts from a filter, and that filter is your ICP whether anyone wrote it down or not.
- Paid spend. Audience definitions inherit the profile, mistakes included, and account based marketing programs inherit it twice over.
- Lead routing. Which inbound leads reach a rep in ten minutes and which sit in a nurture track. Your lead routing rules run on the profile either way.
- Pricing and packaging. Tiers get designed around the accounts you expect to serve.
- Roadmap. Feature requests from out-of-profile customers pull engineering sideways for years.
- Hiring. An enterprise motion and a self-serve motion need different reps, different comp plans, and a different go to market strategy.
Precision is expensive to skip because attention is scarce. Gartner's research on the B2B buying journey found buyers spend only around 17% of their total purchase time meeting suppliers. That sliver gets split across every vendor on the list. Spending it on accounts that cannot buy is not a small waste.
TOPO's account-based benchmark research, later absorbed into Gartner, put win rates at roughly 68% higher for organizations with a strong ICP. Treat the number as directional. The mechanism behind it is the part worth trusting: fewer accounts, better matched, worked harder.
ICP vs buyer persona vs TAM vs target account list
Four terms get swapped in planning meetings, and the confusion costs real money.
Two distinctions matter in practice.
ICP against TAM. Your total addressable market is a sizing exercise. Your ICP is an operating filter. Confuse them and you produce a target list of forty thousand companies, which is the same as having no list.
ICP against persona. The ICP is the company. The persona is the person. The ICP decides whether an account deserves your time. The persona decides who inside it you contact and what you say. Reverse the order and you write sharp messaging aimed at companies that will never sign. Which is why buyer persona work belongs after the account filter.
You need both because nobody sells to one person. Gartner puts a typical B2B buying group for a complex purchase at six to ten decision makers, each arriving with their own research. The profile picks the building. The personas tell you which floors to visit.
What to include in an ICP: the five layers
A profile built on industry and headcount alone describes a segment. The difference between firmographic and technographic data is where teams usually stop. Five layers make it usable.
1. Firmographic fit
The base layer, and the one every team writes.
Industry, employee count, revenue band, geography, funding stage, growth rate, business model. Firmographic data is easy to pull and easy to filter on.
The failure here is vagueness. "Technology" is not an industry. "Mid-market" is not a size. Compare:
- Weak: mid-market technology companies in North America.
- Usable: B2B SaaS companies, 150 to 800 employees, Series B to D, headquartered in the US, UK, or Canada, selling deals above $20K ACV.
The second produces a list. The first produces an argument, and a segmentation exercise you'll have to redo.
2. Technographic fit
Technographics tell you whether your product slots into a company's stack or fights for space.
Three patterns are worth filtering on:
- Required tools. If your product needs a CRM to function, accounts without one are not prospects yet.
- Competing tools. An account two months into a three-year competitor contract is a different conversation from one at month thirty.
- Missing categories. A 500-person company with a CRM and no data enrichment layer has a problem it may not have named.
SMARTe tracks 64K+ technographic products across 66M+ company profiles. That's what makes this layer filterable across a whole prospecting list rather than one account at a time.
3. Situational triggers
The layer that turns a static list into a working queue.
Firmographics tell you an account fits. Triggers tell you it fits now:
- A new VP or CRO in seat, usually with budget and something to prove, which is why tracking job changes pays
- A funding round that just closed
- Headcount growing faster than 30% year over year
- A compliance deadline with a date attached
- A merger that doubled the number of systems nobody can reconcile
- A competitor contract approaching renewal, the strongest buying trigger on this list
Add this layer and your ICP stops being a filter and starts being a prioritization engine. Buying signals keep it current, and third-party intent tells you which accounts started researching your category this month. SMARTe has Bombora intent built in natively.
4. Buying group shape
This layer explains a lot of stalled pipeline, and it rarely makes it into the document.
Say your sale needs a security review, a finance sign-off, and a champion who owns the workflow. An account with no security function behaves differently from one with a CISO. Not worse. Different cycle, different risk, different sequence.
So write it in:
- Who owns budget at this company size
- Who reviews and can block
- Who champions it day to day
- How many people typically have to say yes, which is what buying group intelligence exists to answer
A profile predicting a five-person group and a 90-day cycle is a profile your forecast can use.
5. Economic fit
The layer that separates a marketing document from a business decision.
An account can look perfect on every other layer and still be wrong for you:
- ACV potential. Can this company reach a contract size that pays back acquisition cost?
- Support load. Some segments consume triple the support hours for identical revenue.
- Expansion path. Is there a second team, region, or product to grow into? Expansion revenue is where account economics turn positive.
- Payback period. How long before the account turns profitable?
Everything above this layer describes fit. This one asks whether fit is worth having.
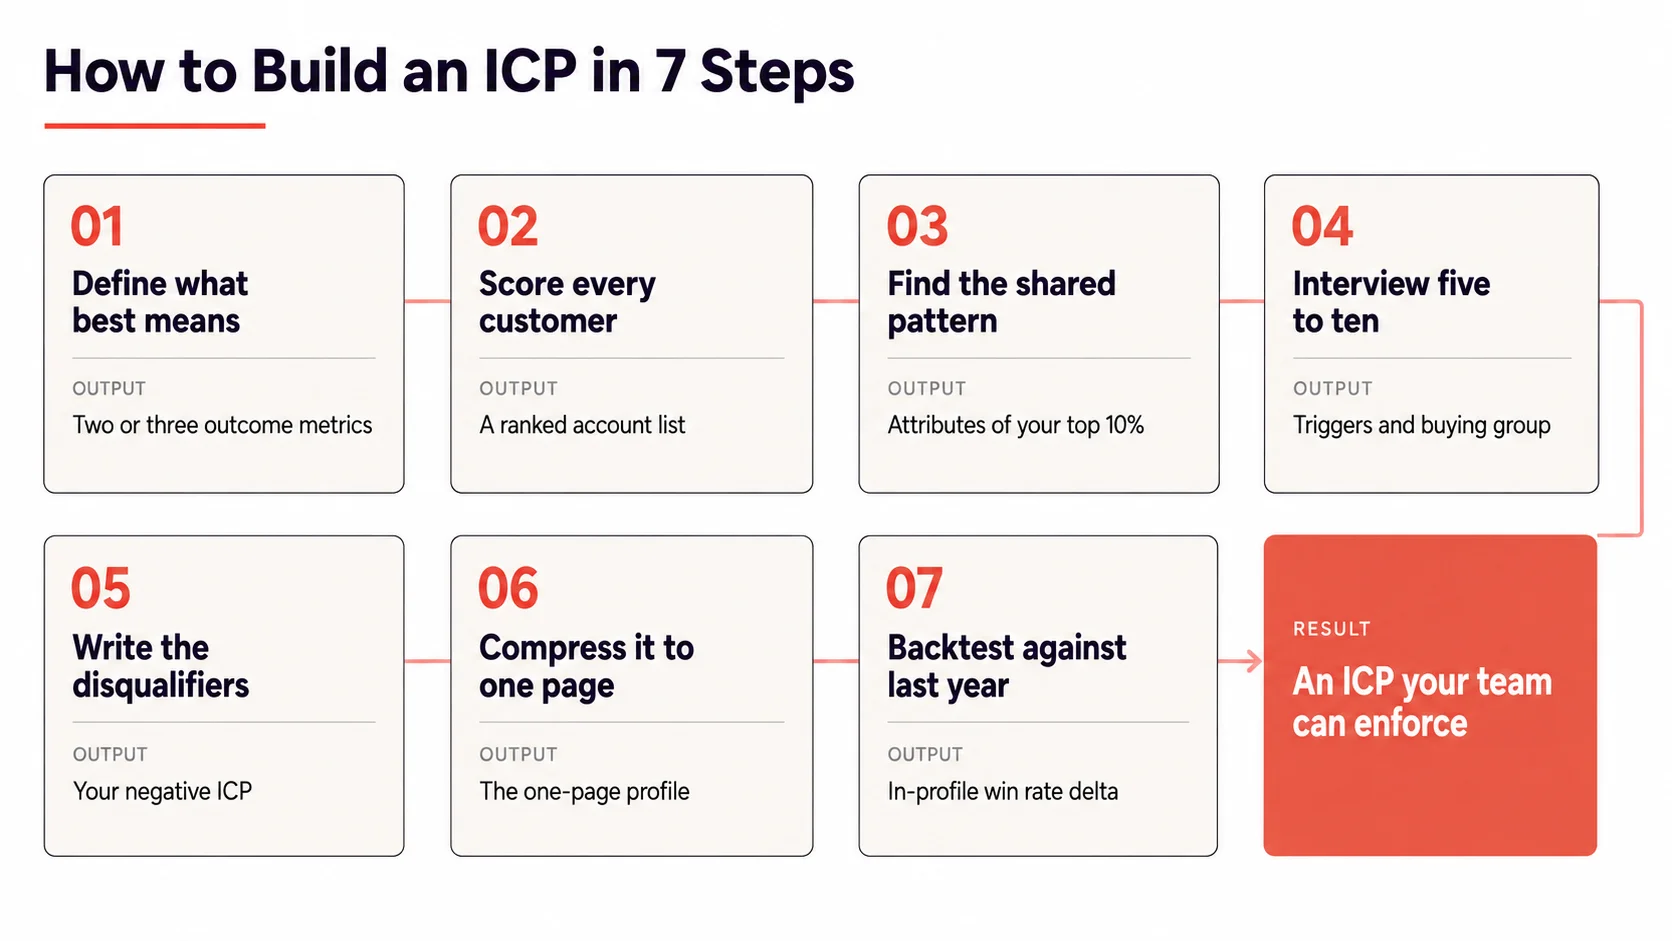
How to build an ideal customer profile in 7 steps
Each step produces something concrete, and none of them needs a consultant.
1. Define "best customer" before you open the data
Skip this and every later step inherits the argument.
"Best customer" is not "biggest logo." It is not "loudest advocate." Pick two or three outcome metrics and write them down first:
- Retained past a defined point, say 18 months, which is a question your customer retention data can answer
- Grew revenue beyond the original contract
- Closed inside your median cycle or faster
- Cost less than average to support
Agree on these before anyone looks at the account list. Otherwise the definition bends around whoever's favourite customer comes up first.
2. Score every customer on those outcomes
Pull 12 to 24 months of closed-won accounts into one sheet. A row per account, a column per outcome.
Weight them if you like. A simple sum works for a first pass. What you want at the end is a ranked list nobody in the room can dispute.
Two traps sit here:
- Survivorship bias. You're looking at accounts that stayed. Pull the churned ones into a second tab. They matter in step seven.
- Recency bias. A deal closed last month has no retention data. Exclude anything too new to judge.
This step is also where the profile stops describing who signed and starts describing who succeeded. Revenue tells you the first. Retention and expansion tell you the second, and only the second predicts anything.
3. Take the top decile and find the pattern
Look at the top 10% of that ranking. Ask what these accounts share that the bottom half does not.
Go attribute by attribute: industry, size, region, funding stage, tech stack, how they found you, who signed, how long they took. You're hunting for attributes where the top group clusters and the bottom group scatters.
Two rules keep it honest:
- An attribute appearing in your best accounts and your worst is not a predictor. Drop it.
- An inconvenient pattern stays in. The data does not care what you'd prefer to sell.
4. Interview five to ten of them
Data tells you what your best accounts have in common. It cannot tell you why they bought.
Call them and ask four questions:
- What was happening in the business when you started looking?
- What were you doing before us, and what broke about it?
- Who else had to approve this, and what did they push back on?
- What nearly stopped you from signing?
Answer one gives you triggers. Answer two gives you the customer pain points worth leading with. Answer three gives you the buying group. Answer four gives you the sales objections your sequence should handle before a rep ever hears them.
Record their exact wording. Verbatim customer language beats anything a copywriter invents, and the same script doubles as discovery call prep.
5. Write the disqualifiers
List the attributes that reliably predict a bad outcome, and treat that list as part of the profile rather than an appendix to it. Full detail on how to build it sits further down.
6. Compress it to one page
A profile that needs a deck will not get used.
One page, containing:
- Three sentences describing the account you want
- The five layers with specific values, not ranges wide enough to mean nothing
- The disqualifiers
- The two or three triggers that make an account urgent
- The buying group you expect to meet
Print it. Put it in the CRM. Read it aloud in pipeline reviews.
7. Backtest it against last year
This step proves the work, and it's the one teams tend to skip because the answer can be uncomfortable.
Score last year's closed-lost deals against the profile you just wrote. Then score last year's closed-won. If the profile is real, in-profile accounts show a materially higher win rate.
If the two numbers look similar, the profile does not predict anything. Return to step three with different attributes.
Ideal customer profile example for a B2B SaaS company
Here's a finished one-pager for a fictional sales enablement platform.
1. Summary. B2B SaaS companies, 150 to 600 employees, Series B to D, in North America and the UK. They run Salesforce, carry more than 25 reps, and are still hiring.
2. Firmographic. B2B SaaS. 150 to 600 employees. $15M to $80M ARR. US, Canada, UK. Series B through D.
3. Technographic. Salesforce or HubSpot as system of record. A sales engagement tool already in place. No enablement platform, or one inside six months of renewal.
4. Situational triggers. New VP of Sales in the last two quarters. Sales headcount up 25% or more year over year. A funding round closed in the last six months.
5. Buying group. VP of Sales as economic buyer. Sales Enablement Manager as champion. RevOps as technical reviewer. Finance approval above $50K.
6. Economic. Target ACV $40K to $120K. Expansion through additional teams and regions. Payback inside 14 months.
7. Disqualifiers. Under 60 employees. Sales teams under 10 reps. No CRM. Agencies and consultancies. More than 12 months left on a competitor contract.
A rep can apply that to a list in under a minute. That's the bar.
Your negative ICP: who to rule out before a rep gets involved
Adding criteria feels productive. Subtracting is where the return sits.
A negative ICP is the explicit list of attributes that take an account off the table regardless of how good the rest looks:
- Below your minimum size. The deal cannot reach a value that pays back acquisition cost.
- Missing a required system. Your product depends on something they do not run.
- Locked contract. A competitor renewal eighteen months out is a nurture, not a pipeline entry.
- No owner for the problem. Nobody's job description includes the thing you fix.
- Regulatory or regional blockers. Data residency rules, procurement policy, sanctioned markets.
- A support profile you cannot serve. Segments needing onboarding you do not staff for.
Two rules make disqualifiers work.
A rep should apply them without escalating. A disqualifier that needs manager approval is a suggestion.
And they belong in your scoring model as deductions, not as absent positives. An account failing on size should lose points rather than simply fail to gain them. Otherwise strong engagement from a hopeless account still routes it to a rep.
Turning your ICP into an account scoring model
A one-page profile creates shared understanding. A scoring model runs without anyone reading the page, on the same logic as any lead scoring system.
Score each account from 0 to 100 across weighted dimensions:
Then tier the output:
- 80 and above. Tier A. Work now, multi-thread the account, run the full sequence.
- 60 to 79. Tier B. Lighter touch. Watch for a trigger to promote it.
- Below 60. Tier C. Nurture only. No rep time.
Three details separate models that work from models reps ignore.
- Weight engagement by seniority. Without it, an intern opening ten emails outranks a VP requesting one demo.
- Decay behavioural points. A demo request from eight months ago is not the same as one from Tuesday. Cut behavioural points 10 to 20% for every 30 days of silence.
- Score the account, not the lead. Six to ten people touch a B2B purchase. Roll their activity up to the account, or the model keeps promoting one curious individual to sales qualified lead status on their own.
The model is only as good as the fields feeding it. Bad CRM data produces confident scores built on blanks, and SMARTe holds 90%+ match rates on enrichment at scale.
How to tell whether your ICP is working
Opinions about the profile are cheap. Five numbers settle the argument.
- Win rate delta. In-profile against out-of-profile. This is the headline. A profile that fails to separate these two is decoration.
- Sales cycle length. In-profile deals should close faster. If they don't, your triggers layer is weak.
- Net revenue retention by segment. In-profile accounts should expand more, and customer churn should concentrate outside the profile.
- Support cost per account. If your best-fit segment burns the heaviest support hours, revisit the economic layer.
- List size. Run the filter against a prospect database. Forty thousand results means you wrote a market segment. Sixty means you cannot build a business on it. A few hundred to a few thousand is usually workable.
Review these quarterly. Two consecutive quarters with no win rate delta means the profile needs rebuilding rather than defending.
Building an ICP with fewer than 20 customers
Everything above assumes a dataset. Early-stage teams don't have one, and running a regression on nine rows produces false confidence.
Do this instead:
- Write a hypothesis ICP and label it a hypothesis. One page, same five layers, built from your founding thesis and whatever early signal exists.
- Interview every customer you have. At this size, ten conversations tell you more than any spreadsheet.
- Log why deals died, not just why they closed. Patterns in losses arrive faster than patterns in wins.
- Review every ten closed deals rather than every quarter. At low volume, ten deals is a sample and a quarter is a lifetime.
- Stay narrower than feels comfortable. Too tight shows up as a thin pipeline, which you can fix in a week. Too wide shows up as eighteen months of unfocused burn, which you cannot.
Honestly, the common early-stage mistake isn't a wrong ICP. It's refusing to commit to one because the data feels thin. Commit, mark it provisional, revise it on evidence.
What makes an ICP go stale, and when to rebuild
Profiles rot quietly. The document stays still while the business underneath it moves.
Three things cause it.
1) The market moved: Rebuild when you change pricing or ship a feature that opens a segment you previously disqualified. Rebuild when a competitor repositions into your core, or average deal size shifts more than 25% in either direction.
2) The data rotted: B2B data decay hits contact and account records every year. A profile filtering on job titles and headcounts drifts out of accuracy without anyone noticing. Re-verification has to be continuous rather than an annual project.
3) Nobody owns it: Two failure modes here, and both are organizational rather than analytical. A profile living in a slide instead of CRM fields, routing rules, and list filters is not in use. And a profile built without sales gets ignored by the people holding pattern recognition your CRM cannot capture.
Between rebuilds, review quarterly and treat it as a data exercise rather than a debate. The accounts that renewed and expanded last quarter are the argument.
The profile only counts when somebody enforces it
A profile earns its keep at the moment somebody says no. No to the inbound lead with the wrong headcount. No to the pilot needing a feature you have no plans to build. No to the logo that would look impressive in a board deck and cost you two engineers.
That's uncomfortable in a quarter where pipeline looks thin. It's also the entire point.
Write it from evidence. Keep it to one page. Argue about it with data instead of anecdotes. Then hold the line long enough to find out whether you were right.