


What's on this page:

SMARTe GTM Intelligence
Start Smarter Prospecting Today
Let me tell you a quick story from my early days in B2B sales and marketing.
I was consulting for a founder—let’s call him Mark. Mark was brilliant. He had built a productivity tool that he was absolutely convinced would be a billion-dollar business overnight. He had the slick pitch deck, the polished demo, and enough energy to power a small city.
But when he stood in front of his first room of serious investors, the lead partner asked him one simple question: "What is your TAM?"
Mark froze. Then, he did what many rookie founders do. He threw out a huge, generic number he’d seen in a random industry report. He said, "Well, the global software market is $500 billion. If we just get 1% of that, we are looking at $5 billion!"
The room went silent. The investors immediately tuned out.
Why? Because Mark didn’t understand his actual market. He hadn't done the math. He was guessing, and in the world of high-stakes business, guessing is fatal.
Mark’s startup didn’t make it. But I share this story because I don’t want that to happen to you. Whether you are a founder building a pitch deck, a product manager planning a roadmap, or a marketer figuring out your Go-to-Market (GTM) strategy, understanding Total Addressable Market (TAM) is not just "nice to have." It is survival.
What is Total Addressable Market (TAM)?
Let's start with the absolute basics before we get into the complex math.
Total Addressable Market, or TAM, is the total revenue opportunity available to a product or service if 100% of the available market share is achieved.
Imagine you are the only person on earth selling water in a desert. Every single person in that desert is thirsty. If you sold a bottle of water to every single one of them at your asking price, the total money you made would be your TAM.
However, in the real world, you are rarely the only seller, and you can rarely reach everyone. But TAM gives you the "North Star"—it tells you how big the prize is if everything goes perfectly.
SMARTe GTM Intelligence
Start Smarter Prospecting Today
The Difference Between "Total Market" and "Addressable Market"
This is where most people trip up. They confuse the "Total Market" with the "Total Addressable Market."
- Total Market: Everyone who exists in a category.
- Addressable Market: Everyone who could actually buy what you sell.
If you sell high-end enterprise software for banks that costs $100,000 a year, your TAM isn't "all banks." It isn't even "all financial institutions." It is "all banks that have the budget, infrastructure, and regulatory clearance to run high-end software."
If you count the small local credit union that still uses paper ledgers and can't afford your license fee, you are fooling yourself.
My Pro Tip: When defining your TAM, be ruthless. A realistic, smaller number is always more impressive to investors than a gigantic, fake number. It shows you understand the nuances of your industry.
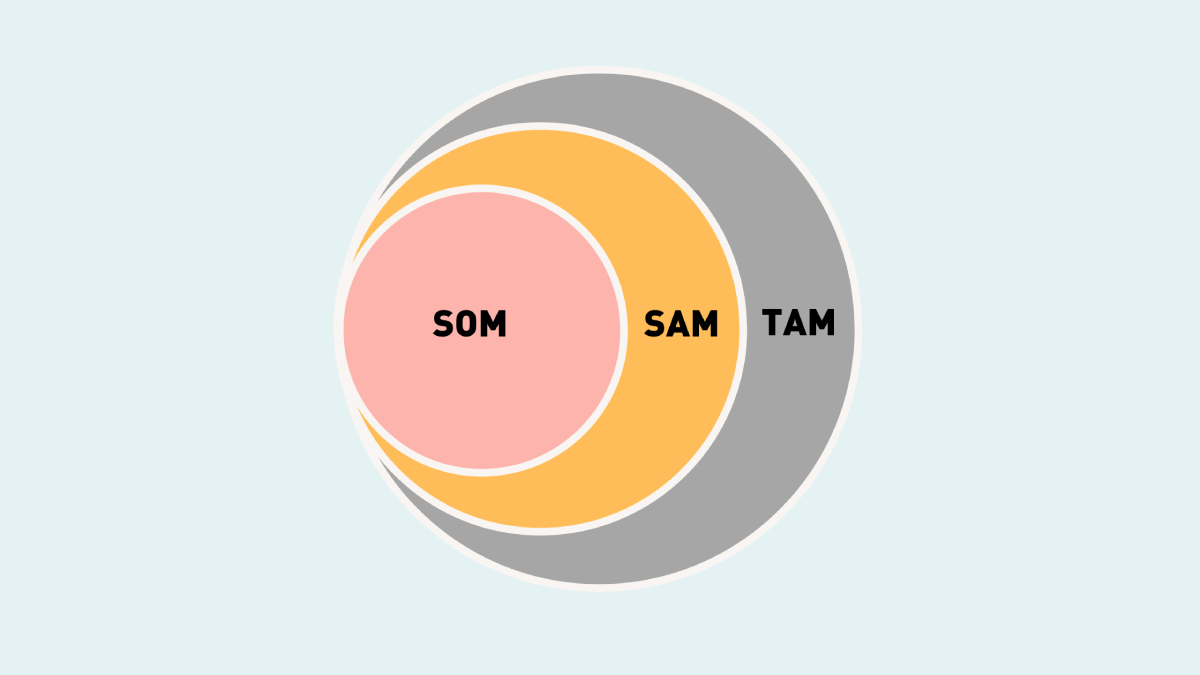
The Holy Trinity: TAM, SAM, and SOM
You cannot talk about TAM without talking about its two best friends: SAM and SOM. Together, TAM, SAM and SOM form the classic framework used in almost every investor pitch deck and marketing plan.
Think of it like an onion, or if you prefer, a fishing pond.
- TAM (Total Addressable Market): The whole onion. The total possible demand for your product across the entire universe of potential buyers.
- SAM (Serviceable Available Market): The layer you can actually reach. This is limited by geography, product language, sales channels, or specific regulations.
- SOM (Serviceable Obtainable Market): The core. This is the slice you can realistically capture right now, considering competition, budget, and current resources.
Let’s Use a Coffee Shop Example
I love using coffee to explain this because everyone gets it. Imagine you are opening a high-end specialty coffee roastery in downtown Seattle.
- TAM: The total revenue of all coffee drinkers in the entire United States. (This is huge, but you can't serve a guy in Florida with a hot latte from your Seattle shop, right?)
- SAM: The revenue of all coffee drinkers in Seattle. (Now we are getting closer. This is the market you can geographically service.)
- SOM: The revenue of coffee drinkers who live or work within 5 blocks of your shop and prefer specialty coffee over the big chains like Starbucks. (This is your actual target for year one).
Why This Distinction Matters
If you build your business plan based on the TAM (the whole US), you will overspend on marketing and go broke. You need to budget based on your SOM, while keeping your eyes on the SAM for future growth.
Why Does TAM Matter? (The "So What?")
I’ve had clients ask me, "Why do I need to calculate this? Can't I just sell and see what happens?"
Sure, you can. But that’s like driving a car blindfolded. Here is why TAM is critical for specific roles in B2B:
1. For Founders & CEOs: Validation
Before you spend years of your life and millions of dollars building a product, you need to know if the market is big enough to support it. If your TAM is only $5 million, and you need $10 million to break even, you have a math problem before you even write a line of code.
2. For Investors: The "Unicorn" Test
Venture Capitalists (VCs) look for massive returns. They want to see a path to a billion-dollar valuation. A well-calculated TAM shows them the potential scale. If your TAM is too small, they will pass, because even if you win 100% of the market, the return isn't big enough for their fund model.
3. For Marketers: Focused Spending
As a B2B marketer, I use TAM to figure out where to spend my budget. If I know my Serviceable Market is mostly in the healthcare sector, I won't waste money running ads to retail companies. It helps you focus your "spear" so it hits the target.
4. For Sales Leaders: Territory Planning
You can't hire 50 sales reps if your TAM only supports 10. Knowing your numbers helps you assign territories that are fair and profitable.
How to Calculate TAM?
This is the meat and potatoes of the article. How do you actually get the number? There are three main ways to calculate total addressable market.
While there is no single "perfect" number, the methodology you use to reach that number tells a story about your strategic thinking. There are three primary frameworks for calculating TAM:
- Top-Down: The Macro Approach
- Bottom-Up: The Data-Driven Approach
- Value Theory: The Innovation Approach
Below, we break down how each works, provide unique real-world examples, and analyze the pros and cons.
1. Top-Down TAM
Best for: Early-stage ideation and rough estimations.
The Top-Down approach follows an "inverted pyramid" logic. You start with a massive, general population and apply demographic, geographic, or economic filters to narrow it down to your specific market segment. This method relies heavily on secondary market research (reports from Gartner, Forrester, Statista, etc.).
How it Works
- Find the total market size (total population or total businesses).
- Apply a filter for your specific industry.
- Apply a filter for your specific geography or demographic.
- Multiply the remaining number by the average market price.
Example: "Organic Dog Food Subscription"
Imagine a startup launching a premium organic dog food delivery service in the United States.
- Macro Data: Research shows there are roughly 130 million households in the US.
- Filter 1 (Pet Ownership): Industry reports state 40% of households own a dog. (130M×0.40=52M households).
- Filter 2 (Income Level): Only the top 20% of income earners can afford premium organic food. (52M×0.20=10.4M households).
- Calculation: If the subscription costs $500 per year:
10,400,000 households×$500=$5.2 Billion TAM
The Verdict
- Pros: Fast and cost-effective. Excellent for generating "headline numbers" for pitch decks when you lack internal data.
- Cons: often creates a "false sense of precision." It ignores whether customers actually want your product or if competitors already dominate that space. It typically results in overly optimistic numbers.
2. Bottom-Up TAM
Best for: B2B SaaS, active businesses, and fundraising.
The Bottom-Up method is widely considered the "Gold Standard" by investors. Instead of looking at the world at large, you look at your own data. You take proven sales metrics from a smaller sample size (like a beta test or a specific city) and extrapolate them to the broader market.
How it Works
The formula for Bottom-Up TAM is:
TAM=(Total Number of Target Accounts)×(Annual Contract Value (ACV))
Example: "HR Software for Remote Teams"
Let’s look at a B2B SaaS company selling HR tools to tech startups. They cannot look at every company, so they look at their own sales data.
- Primary Data: They successfully sold their software to 500 companies during a pilot program.
- Pricing: The average deal size (ACV) was $2,000 per year.
- Extrapolation: They identify that there are 50,000 similar tech companies in their target region (verified through databases like LinkedIn or Crunchbase).
- Calculation:
50,000 potential accounts×$2,000=$100 Million TAM
The Verdict
- Pros: Highly accurate and defensible. Because it is based on actual sales or engagement data, it proves not just market size, but also product-market fit.
- Cons: Time-consuming. It requires you to have existing customers or run pilot programs to get reliable data on Average Contract Value (ACV).
Pro Tip: Investors almost always prefer the Bottom-Up approach because it shows you understand your customer profile, not just global statistics.
3. Value Theory TAM
Best for: Category creators, startups, and new technologies.
What if you are building something that has never existed before? Traditional market reports won't help you, and you have no sales history. Enter Value Theory. This method estimates market size based on how much value your product creates and how much of that value you can capture via pricing.
How it Works
- Estimate the financial value your product provides to a user (money saved or revenue generated).
- Determine a reasonable percentage of that value to charge (pricing).
- Estimate the number of users who have the problem you solve.
Example: "AI Coding Assistant"
A startup builds an AI tool that writes code for developers, speeding up their workflow.
- Value Creation: The tool saves the average developer 10 hours per month.
- Monetization: If a developer's time is worth $60/hour, the tool creates $600/month in value for the company.
- Pricing Assumption: The startup decides they can reasonably charge 10% of the value created ($60/month).
- Market Scope: There are approximately 25 million software developers globally.
- Calculation:
25,000,000 developers×$720 (annual cost)=$18 Billion TAM
The Verdict
- Pros: Excellent for justifying pricing strategy and positioning "disruptive" products. It focuses on the problem-solving capability of the solution.
- Cons: Highly subjective. If your assumption about how much value the user perceives is wrong, the entire calculation falls apart.
Summary Comparison
A Real-World Case Study: "Dental-SaaS Co."
Let’s put this into practice with a real-world example using actual data I pulled for this article.
Imagine we are launching "Dental-SaaS Co," a CRM specifically designed for dental practices in the US.
Step 1: The Data Hunt (Finding "N")
First, we need to know how many dental practices exist. We don't guess. We look for authoritative sources.
According to Report Linker and the CDC, there are approximately 202,000 professionally active dentists in the US as of recent estimates.
However, not every dentist owns a practice. Many work in groups. Let's be conservative and estimate the number of buying entities (clinics or offices) is roughly 150,000.
Step 2: The Pricing (Finding "P")
Our software is premium. We charge 300 dollars per month.
Annual Contract Value (ACV) = 300 x 12 = 3,600.
Step 3: Calculating TAM (Bottom-Up)
150,000 (Total Practices) x 3,600 (ACV) = 540,000,000.
Our TAM is 540 million dollars.
Step 4: Calculating SAM (Serviceable Available Market)
We are a startup. We only have sales reps on the East Coast, and our software is currently compliant with regulations in 10 specific states. These 10 states represent roughly 20 percent of the US market.
150,000 practices x 20 percent = 30,000 serviceable practices.
30,000 x 3,600 = 108,000,000.
Our SAM is 108 million dollars.
Step 5: Calculating SOM (Serviceable Obtainable Market)
This is the reality check.
There are two major competitors who already own 60 percent of the market.
That leaves 40 percent of the market open.
With our current marketing budget of 50,000 dollars per month, we can realistically hope to capture 5 percent of the available SAM in the next 18 months.
30,000 (SAM practices) x 5 percent = 1,500 target customers.
1,500 x 3,600 = 5,400,000.
Our SOM is 5.4 million dollars.
The Narrative for Investors
When I pitch this, I don't say, "We have a billion-dollar idea."
I say, "We are targeting an immediate 5.4 million dollar opportunity (SOM) with a clear path to a 108 million dollar regional market (SAM), and a long-term potential to capture a slice of the 540 million dollar national market (TAM)."
This sounds grounded, realistic, and trustworthy.
Where to Find the Data (The "Source of Truth")
You might be thinking, "Okay, but where do I find these numbers?" You can't just make them up. To build a defensible TAM, you need data that holds up under scrutiny—whether that's from a board member or a skeptical potential partner.
Here are the specific data sources I rely on to build accurate market models:
1. Government Databases
These are free, highly accurate, and often overlooked.
- US Census Bureau: Look for "County Business Patterns" (CBP) or "Nonemployer Statistics." For example, if you sell to solopreneurs, Census data is invaluable for finding the exact count of non-employer businesses in specific regions.
- Bureau of Labor Statistics (BLS): This is my go-to for understanding employment density by sector. If you need to know how many manufacturing jobs exist in the Midwest, this is where you look.
2. Public Financial Filings (10-Ks)
If you have a public competitor (like Salesforce, HubSpot, or Oracle), read their annual reports (Form 10-K). They are legally required to be accurate. They often list their own market estimates and growth projections. If a giant like Salesforce states that the CRM market is growing at 12%, you can confidently cite that in your own analysis.
3. Reputable Industry Reports
- Gartner & Forrester: These are the gold standards for Tech and IT. While full reports are expensive, their press releases often contain the key high-level numbers you need, such as global IT spending forecasts.
- Statista: Excellent for quick, verified statistics on specific verticals, from dental practices to e-commerce trends.
4. LinkedIn Sales Navigator
This is a classic "hack" for Bottom-Up sizing. You can go to Sales Navigator, filter by "Industry," "Headcount," and "Location," and get a rough headcount of companies. It’s useful for a quick estimate, but it has limits—it only shows you who is on LinkedIn, not the total market reality.
5. The Professional’s Choice: SMARTe
While the sources above are great for general estimates, they often lack the granularity needed for a truly precise GTM strategy. You don't just need to know "how many companies exist"—you need to know who has the budget, the intent, and the verified contact information.
This is where I use SMARTe.
Unlike static databases or generic LinkedIn scrapes, SMARTe provides global, accurate B2B data coverage. It allows you to drill down into your TAM with incredible precision, identifying not just companies, but the specific decision-makers within them, along with mobile numbers and verified emails.
When I need to move from "market sizing" to "market capturing," I stop guessing with census data and start building lists with SMARTe. It bridges the gap between knowing your market size and actually contacting it.
Want to see exactly how big your addressable market really is?
Book a Demo with SMARTe today and let us help you uncover your true revenue potential.
Common Mistakes to Avoid (The "Red Flags")
I have reviewed hundreds of GTM strategies. Here are the most common mistakes that make experts roll their eyes.
1. "Everyone is my customer"
No, they aren't. Even Facebook doesn't have everyone. If you say your TAM is 8 billion people, you have lost credibility. Niche down.
2. The "China Syndrome" (1% Fallacy)
This is the classic error: "If we just get 1% of the population of China to buy our toothpaste..."
Capturing 1% of a massive market is actually harder than capturing 20% of a niche market. It requires mass-market advertising budgets that startups don't have.
3. Confusing Revenue with Users
TAM is measured in dollars (or currency), not people.
- Wrong: "My TAM is 1 million people."
- Right: "My TAM is $100 million" (1 million people x $100).
4. Using Global Numbers for a Local Business
If you are a logistics company that only has trucks in Texas, do not quote the "Global Logistics Market Size." It’s irrelevant. Stick to your SAM.
Advanced TAM Concepts
Once you master the basics, you can start using TAM for advanced strategic planning.
TAM Expansion
Your TAM isn't static. It grows as you launch new products.
- Phase 1: You sell CRM software. TAM = $500M.
- Phase 2: You add a "Payment Processing" feature. Now you can tap into the transaction market. Your TAM expands to $800M.
Investors love to see a "TAM Expansion Strategy" in your roadmap.
Serviceable OM vs. Penetrated Market
- SOM: Who you can get.
- Penetrated Market: Who you have got.
Tracking the gap between these two tells you how much "runway" you have left in your current niche before you need to expand.
Conclusion: It’s Not Just a Number, It’s a Mindset
We have covered a lot of ground here. We defined Total Addressable Market, broke down the TAM SAM SOM framework, looked at the Bottom-Up calculation method, and walked through a real example with dental clinics.
If you take one thing away from this article, let it be this: TAM is not just a number you put on a slide to impress people. It is a tool for you.
It helps you understand the battlefield. It tells you if the prize is worth the fight. It forces you to be realistic about who your customers are and what they are willing to pay.
As a B2B marketing professional, I use TAM thinking every single week. When we launch a new campaign, I ask, "Who is the addressable audience for this specific message?" When we look at sales territories, we ask, "Is the TAM in this region big enough to support a full-time sales rep?"
Do the work. Dig into the data. Build your Bottom-Up model. It might be tedious, but it gives you a foundation of rock rather than sand.
Your Next Step:
Open a spreadsheet right now.
- List your Ideal Customer Profile (ICP).
- Find the count of those customers in your region (use SMARTe).
- Multiply by your Average Deal Size.
That number on your screen? That’s your potential. Now go capture it.


