
Table of content

SMARTe GTM Intelligence
Start Smarter Prospecting Today
TL;DR:
Revenue forecasting models are methods sales and finance teams use to predict future income across a quarter, half-year, or full year. They draw from historical data, current pipeline, and market assumptions to give revenue leaders a number to plan around.
The six most common models in B2B sales:
- Pipeline-stage probability (weighted pipeline)
- Historical run rate
- Bottom-up, also called the sales capacity model
- Top-down
- Scenario-based forecasting (commit, best case, pipeline tiers)
- AI-assisted multivariable forecasting
No model works without clean data. Most forecast failures trace to stale contacts, wrong deal stages, and CRM records nobody updated.
Revenue forecasting models help sales and revenue teams estimate how much revenue they are likely to generate in a future period. The challenge is that no single model works for every business. A SaaS company with a short sales cycle needs a different approach than an enterprise team managing six-month deals.
Over the years, I've found that forecast accuracy depends less on finding the "perfect" model and more on choosing the right model for your sales motion, team size, and data quality. Some models rely on historical performance. Others focus on pipeline health, sales capacity, or buyer behavior.
In this guide, I'll break down the six revenue forecasting models B2B teams use most often, where each model works best, where it falls short, and how to choose the right one for your business.
Why Most B2B Revenue Forecasts Miss
Two things kill forecast accuracy in B2B sales. Rep optimism gets most of the blame. Data decay goes mostly unaddressed.
Reps are optimistic by training and by nature. (That's partially why they're good at their jobs.) They weigh their last strong call too heavily. They undercount deal age, missing stakeholders, and competitive signals. Left uncalibrated, rep-submitted forecasts run 20 to 30% high on average.
But rep bias is well understood. Most revenue operations teams have some calibration process for it. The harder problem is B2B contact data decay.
B2B contact data goes stale at roughly 22% per year. A list you built in January is already wrong by March. Wrong titles, departed decision-makers, companies that restructured. When those contacts populate your conversion rate calculations, the rates lie. And when the rates lie, every model downstream produces confident-looking numbers that don't hold.
The CRM Problem Nobody Raises in Forecast Reviews
Most forecast reviews focus on the pipeline in front of them. Which deals will close? They don't ask a harder question: are these accounts even accurate?
If your CRM has a meaningful share of records with wrong company size, wrong industry, or wrong revenue tier, your segment-level conversion rates are wrong too. You think mid-market deals close at 35%. But some of those "mid-market" accounts are SMBs with inflated headcount fields. They close at 22%. The model can't tell the difference.
Bad CRM data doesn't just misrepresent individual deals. It corrupts the historical benchmarks your model was trained on. That's the part teams miss when they invest in forecasting software without fixing the underlying records first.
The 6 Revenue Forecasting Models B2B Teams Use
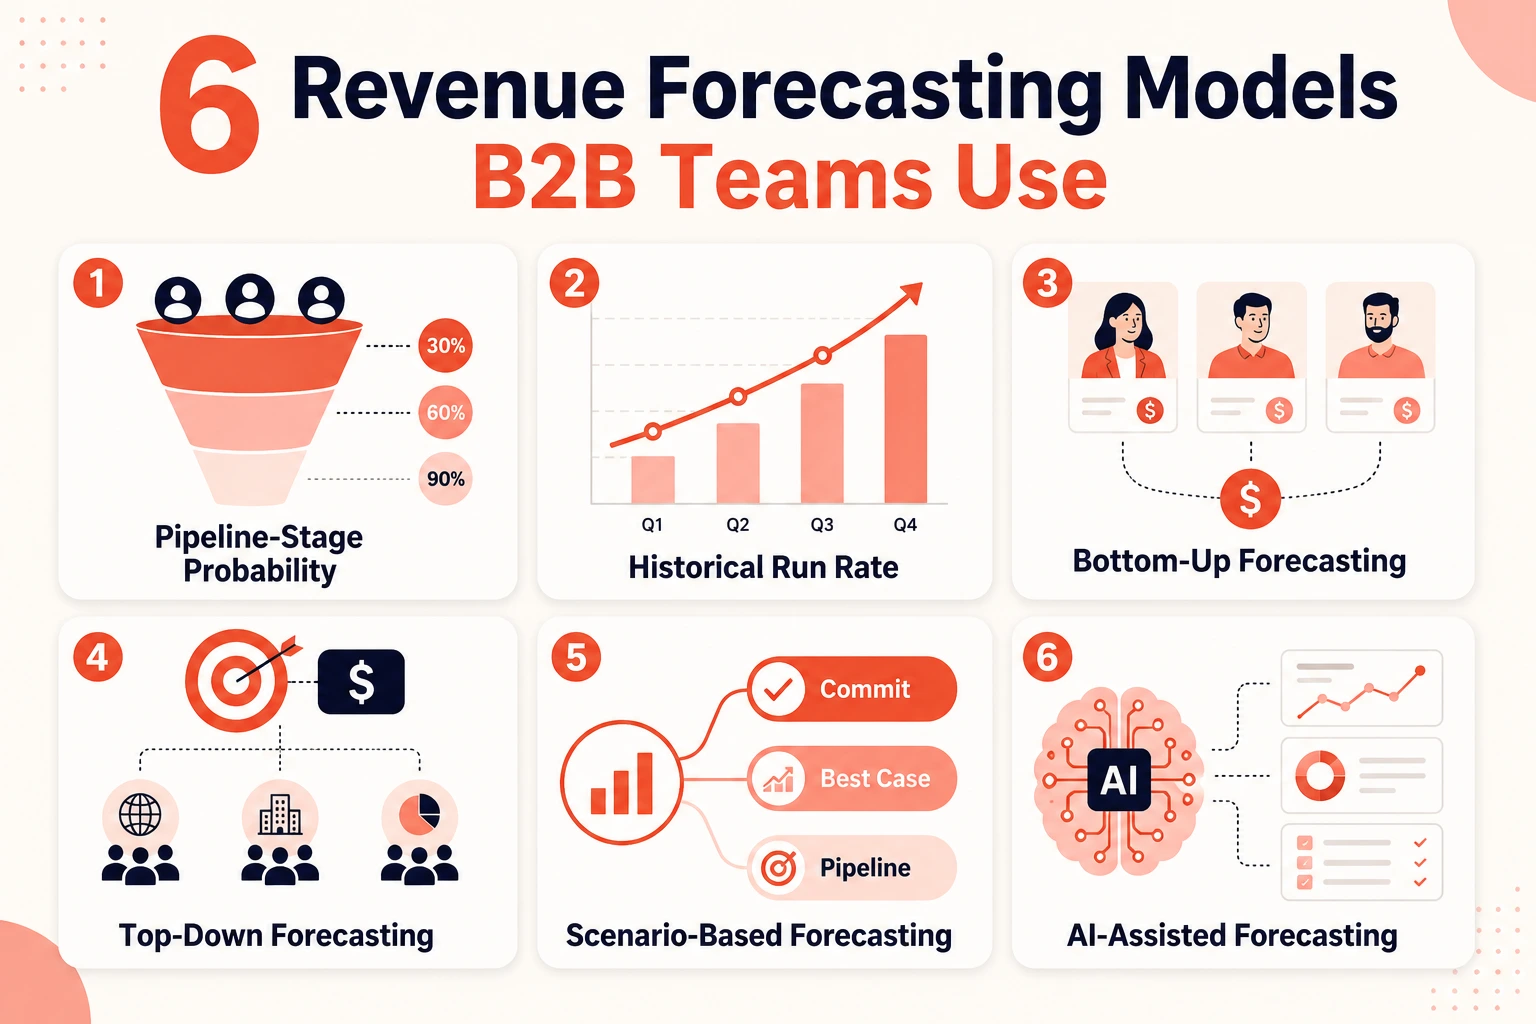
1. Pipeline-Stage Probability
This is the most common revenue forecasting model in B2B SaaS. You assign a close probability to each deal based on its current pipeline stage. A deal at "Proposal Sent" might carry 60%. A deal at "Verbal Commitment" might carry 90%. Multiply each deal's value by its probability, sum everything, and you get your weighted forecast.
What works: this model ties directly to real activity, not abstract market assumptions. It changes when deals move. You get a live number that finance can use.
Where it breaks: the probabilities are only valid if your stage definitions are consistent across reps. One rep's "Verbal Commitment" is a genuine close signal. Another's is "I think they liked the demo." Same stage, very different close probability.
It also fails when accounts don't exist. If 15% of your pipeline contains contacts who've left their company or changed roles since you last enriched the data, your $10M pipeline is actually smaller. The model doesn't know that.
2. Historical Run Rate
The simplest model. Take your last four to six quarters of revenue, calculate your average growth rate, and project it forward. If you've grown 11% quarter-over-quarter for three straight quarters, you project 11% growth next quarter.
Fast, defensible, easy to explain. For companies with stable recurring revenue, it's a solid starting point.
Honest caveat: this model fails the moment your business shape changes. New pricing, new segment, or a new product line will make the historical window misleading. Run rate treats the future like the past. That's only useful when they actually resemble each other.
Use it as a sanity check against more forward-looking models. Don't use it as your primary forecast during a growth phase.
3. Bottom-Up (Sales Capacity Model)
Start with your individual reps. For each rep, calculate how many accounts they can work per quarter, what their conversion rate is from first meeting to close, and what their average deal size looks like. Factor in ramp curves for recently hired reps versus fully tenured ones.
Roll those numbers up across the team and you get a capacity-based projection.
This model surfaces a specific kind of problem early: you realize you don't have enough ramped reps to hit the target. That's a different and more actionable conversation than "pipeline coverage is low."
Where it breaks: it can only forecast deals that currently exist. Teams where 20 to 30% of quarterly revenue comes from same-quarter pipeline generation will consistently under-forecast with this model alone. It doesn't predict deals that haven't entered the funnel yet.
4. Top-Down Forecasting
Start from a revenue target set by leadership or the board and allocate it down across segments, regions, and teams.
Useful for long-range planning and board-level conversations. It answers: if we're targeting X% of our addressable market in three years, what does each team need to produce?
The problem I've watched this cause, especially at Series B companies: top-down forecasts become targets masquerading as forecasts. A CEO commits to the board on $60M. The CRO allocates the number down. Three months later, the actual pipeline says $48M is realistic, and now the whole organization is scrambling to make a top-down target "work" against reality.
Top-down is best used as a strategic planning input. Run it alongside a bottom-up model and let the gap between the two outputs tell you something useful, not become a pressure point.
5. Scenario-Based Forecasting (Commit / Best Case / Pipeline)
Instead of one number, you produce three:
Commit: Deals that will almost certainly close this quarter. You'd stake your credibility on these.
Best Case: Likely deals if current momentum holds. Things look good, but nothing is locked.
Pipeline: Stretch opportunities with real potential but meaningful risk.
Each tier uses different probability weights. Commit relies heavily on rep judgment. Pipeline relies more on stage-based data. Senior leadership gets a range to plan around rather than one uncertain number to argue about.
This model gives you better communication tools. When a CFO asks for the revenue figure, you can say: "Commit is $4.2M. Best case is $5.8M. Here's what we need to convert to reach the top of that range." That's a productive conversation. One number with no context usually isn't.
The downside: disciplined rep input is non-negotiable. If reps game the tiers to avoid accountability, everything ends up in "pipeline" and nothing in "commit." The model becomes noise.
6. AI-Assisted Multivariable Forecasting
Machine learning models trained on your historical CRM data look at dozens of signals at once: deal age, email response rates, stakeholder count, rep activity, competitive signals, engagement patterns. They generate probabilities that no human would calculate manually.
Per Salesforce's State of Sales research, sales teams using AI are 1.3x more likely to see revenue increase year-over-year.
A problem I've watched trip up teams that move to AI forecasting: the training data quality cap. If your historical CRM data was dirty, the model trains on noise and produces confident-looking but unreliable outputs. Sophisticated garbage out. The model is only as good as the data it learned from.
For teams with two or more years of clean, consistent CRM data and stable stage definitions, this model is genuinely strong. For teams earlier in their RevOps maturity, it's worth the investment but only after a serious data cleanup pass and an honest assessment of RevOps KPIs and metrics to measure progress.
Top-Down vs Bottom-Up: What Actually Differs
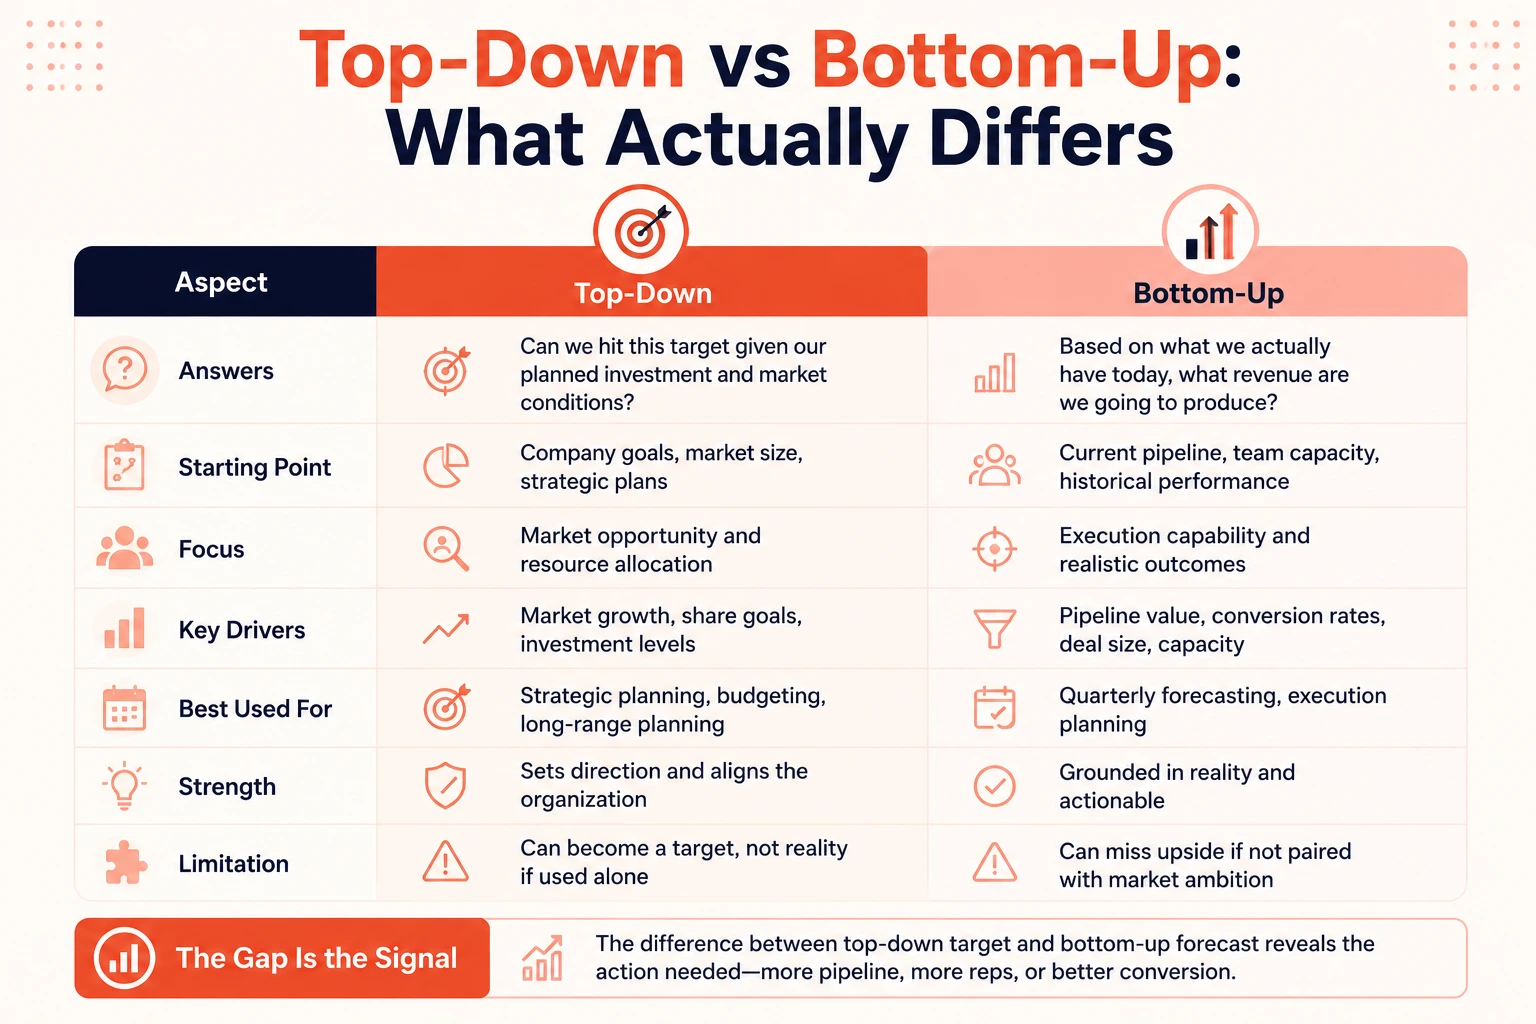
These two get treated as opposites. They're complementary tools that answer different questions.
Top-down answers: can we hit this target given our planned investment and market conditions?
Bottom-up answers: based on what we actually have today, what revenue are we going to produce?
The gap between those two numbers is the most useful data point in your whole forecasting process. If your bottom-up says $4.2M and your top-down target is $6M, that $1.8M difference isn't just a planning gap. It tells you how much additional pipeline you need, how many ramped reps you're short, or where conversion rates need to improve.
Most revenue teams run one of these and treat the other as optional. I think that's a mistake. The strongest teams run both every quarter, build the gap analysis explicitly, and use it to drive decisions before the quarter starts rather than after it ends.
How Data Quality Determines Forecast Accuracy
No model, regardless of its mathematical sophistication, produces a useful output from bad inputs.
B2B contact data decays at roughly 22% per year. A rep who built their target account list in January is working with records that are already wrong by spring. Decision-makers changed roles. Companies got acquired or restructured. The "VP of Sales" you've been nurturing no longer holds that title.
When those contacts populate your pipeline, your conversion rates lie. Your team calculated those historical win rates from clean accounts. New pipeline includes dirty ones. The rate you think applies to a deal no longer does.
This compounds with firmographic data. If your CRM has a significant share of accounts miscategorized by revenue band or employee count, your segment-level models are wrong. You believe enterprise accounts close at 45%. But some of those "enterprise" records are actually mid-market with inflated headcount fields, and they close at 28%. The model applies the wrong probability and you miss.
HubSpot's State of Sales research shows fewer than 20% of sales organizations achieve forecast accuracy above 75%. In my experience, the teams sitting in that top tier almost always have the same answer when you ask about their data practices: they treat CRM data enrichment as ongoing operations, not a one-time cleanup sprint.
What Accurate Contact Data Actually Changes
When your pipeline reflects who actually works at an account today (correct titles, current contact data, real company size), three things shift.
Your conversion rates stop lying. The historical benchmarks your model uses match the current quality of your pipeline.
Your rep time goes to real opportunities. Reps working accounts with stale contacts burn hours on calls that go nowhere and emails that bounce. Clean data means the working list actually works.
Your forecast becomes trustworthy enough to act on. That last point is underrated. Leadership that doesn't trust the forecast makes conservative decisions. Teams that trust their numbers move faster and invest earlier.
SMARTe's CRM enrichment runs real-time verification against 289M+ verified B2B contacts, not batch updates. The records in your pipeline reflect who actually works at those accounts today. That's what closes the gap between model accuracy and actual closed revenue. Try SMARTe free, no credit card required.
How to Choose the Right Revenue Forecasting Model
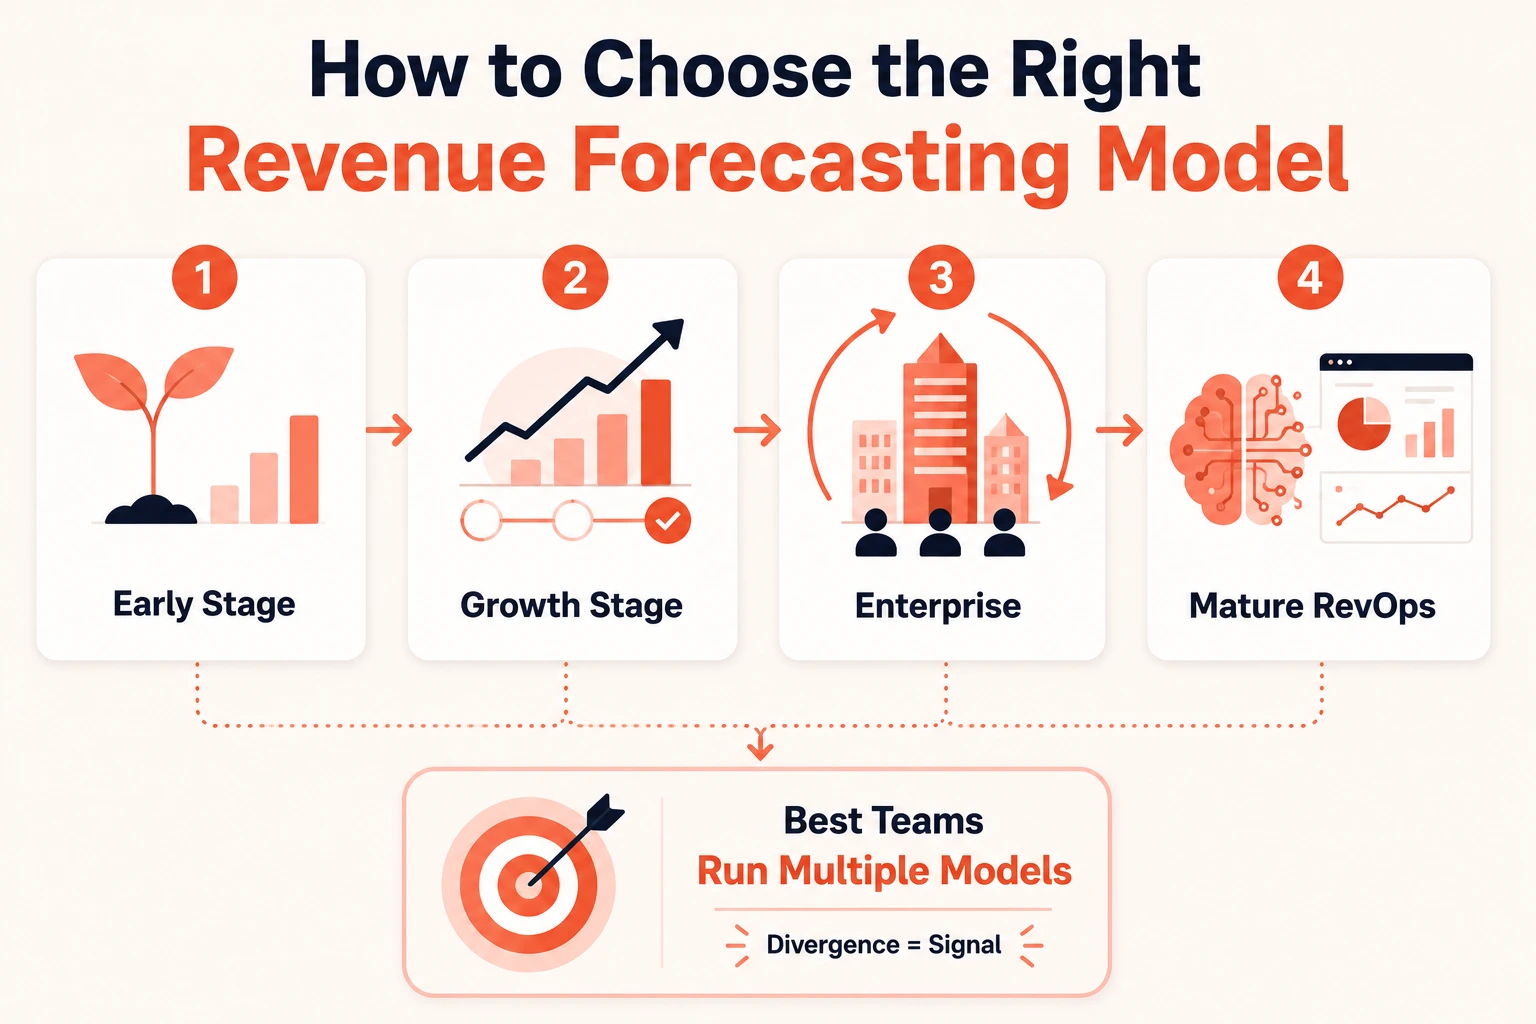
There's no single right model. The right question is which combination fits your sales motion right now.
A rough heuristic that holds up:
Early-stage (under $5M ARR): Historical run rate plus bottom-up. Simple, defensible, builds the data discipline you need before adding complexity.
Growth-stage SaaS ($5M to $50M ARR): Pipeline-stage probability plus scenario-based. You have enough pipeline and enough reps to benefit from both. Run them in parallel and use the delta as your planning input.
Enterprise B2B (long cycles, large ACVs): Scenario-based plus bottom-up capacity model. Long sales cycles make AI models harder to train with enough volume. Human judgment on tier classification matters more here.
Mature RevOps teams (2+ years of clean historical data): Layer in AI-assisted multivariable as a third model alongside pipeline probability. Use it to calibrate rep judgment, not replace it.
Your ideal customer profile also shapes which model fits. Teams selling to a narrow ICP with well-understood conversion patterns can run leaner models and trust the rates. Teams selling across multiple segments, geographies, or product lines need segment-level decomposition or the aggregate numbers mask too much.
The teams hitting 85%+ accuracy consistently don't pick one model. They run two or three, examine where the outputs diverge, and investigate the divergence. That's where the most useful signal lives.
Intent Data and Buying Signals as Forecast Inputs
Most forecasting models work with pipeline you already have. Intent data tells you which accounts are moving toward a purchase before they even appear in your pipeline.
Integrating intent signals into your forecast changes the model in a specific way. It helps you weight near-term close probability for accounts already in the pipeline, and it surfaces accounts not yet in the pipeline that should be.
Buying signals like funding events, leadership changes, technology replacements, and content consumption patterns can shift a deal's probability meaningfully. An account that just raised a Series B and is actively researching your category belongs at a different probability tier than an account with no engagement signals. The pipeline-stage model can't tell that story on its own.
For RevOps teams using signal stacking, the combination of multiple intent signals on a single account is one of the strongest predictors of near-term close. SMARTe integrates natively with Bombora intent data, so buying signals flow directly into your prospecting workflow rather than sitting in a separate tool you have to reconcile manually.
Lead scoring built on intent data also improves where AI-assisted forecasting models assign probability weight. Instead of relying solely on CRM activity, the model factors in third-party behavioral signals. That makes the AI layer more predictive, not just more complex.
Putting the Pieces Together
Revenue forecasting is a process. It starts with the data in your CRM, runs through a model, and produces a number that leadership has to stand behind. Most of the attention goes to the model. Most of the failures start with the data.
The teams I've seen get this right don't argue about which model is mathematically superior. They argue about whether their pipeline data is trustworthy enough to run through any model. That's the right conversation.
A great model on dirty data produces a great-looking wrong number. Clean data run through even a simple model produces a number you can actually act on.
Want to see what accurate contact data does to your forecast accuracy? Book a demo to see SMARTe's real-time enrichment in action.